Figure 3.
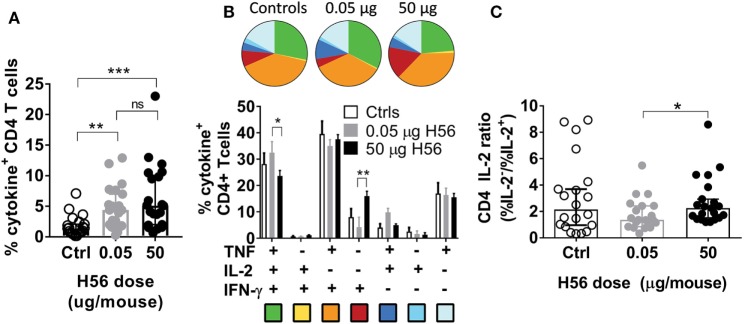
Non-protective, high dose post-exposure vaccination is associated with a more differentiated T cell response. One week post the final vaccination in the post-exposure model, mice were immunized with saline (controls, open bars/symbols), a low (0.05 µg, gray bars/symbols) or high (50 µg, filled black bars/symbols) dose of H56, and were assessed for vaccine-specific immune responses in the lung. (A) The proportion of lung CD4 T cells specific for H56 determined by intracellular cytokine stain (producing any cytokine of IFN-γ, TNF, IL-2, or IL-17A) after stimulation in vitro with H56 with media control background subtracted. Symbols, individual mice; bar, mean ± 95% CI; **p < 0.01, ***p < 0.001 by one-way ANOVA (Kruskall–Wallis)/Dunn’s posttest for multiple comparisons between all groups. (B) Boolean analysis of the same data from panel (A), showing the proportion of lung CD4 T cells producing any combination of the cytokines IFN-γ, TNF, and/or IL-2 after stimulation in vitro with H56. Background from media controls was subtracted. Pie charts and bars (mean ± SEM) represent the relative distribution of CD4 T cell subsets producing different cytokine combinations out of total cytokine-producing CD4 T cells (the total for each group equals 100%, relative values were chosen to eliminate variation in response-magnitude between experiments). Pie color-coding is indicated below the bar graph. *p < 0.05, **p < 0.01 by a two-way ANOVA and Tukey’s multiple comparisons (the relative values were normally distributed). (C) From the data shown in panel (B), we calculated the relative ability of vaccine specific CD4 T cells to produce IL-2. An IL-2 ratio (%IL-2−/%IL-2+) was calculated for any CD4 T cell producing IFN-γ, TNF, or IL-2 after H56 stimulation—a higher ratio indicates lower IL-2 production (higher differentiation) of H56-specific T cells. Statistical difference between high and low dose vaccine groups was assessed Wilcoxon’s signed rank test. *p < 0.05. Data combined from seven experiments (see Materials and Methods for experiment inclusion).

