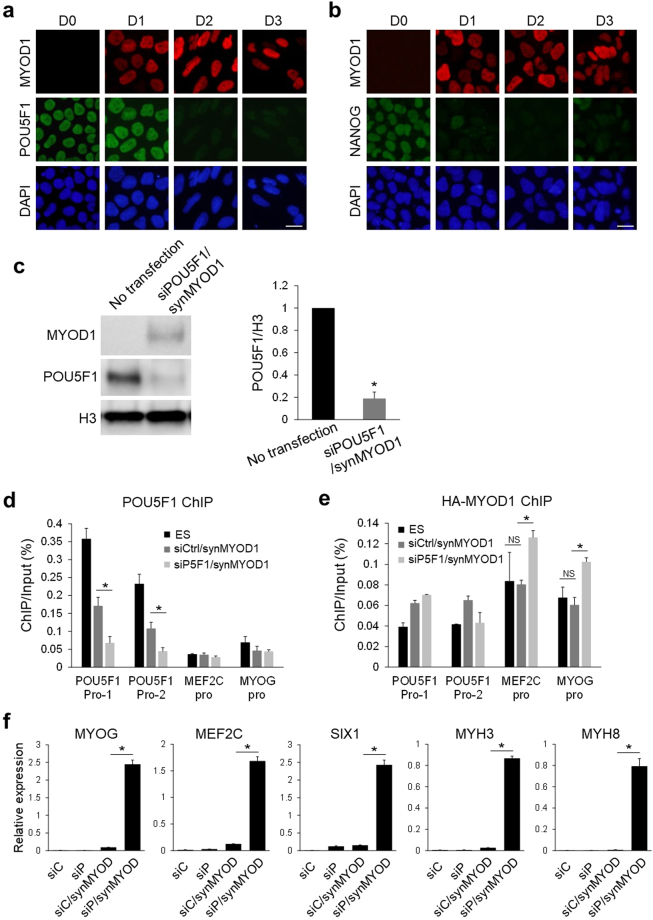
Figure 2.
POU5F1 knockdown facilitates synMYOD1-induced myogenic gene activation. (a) Immunostaining analysis for POU5F1 in the siPOU5F1 and synMYOD1 (siPOU5F1/synMYOD1)-transfected cells at day 0 to day 3 post transfection. MYOD1 was detected by the specific antibody. Nuclei were stained with DAPI. Scale bar: 10 μm. (b) Immunostaining analysis for NANOG in the siPOU5F1/synMYOD1-transfected cells at day 0 to day 3 post transfection. MYOD1 was detected by the specific antibody. Nuclei were stained with DAPI. Scale bar: 10 μm. (c) Immunoblotting analysis for POU5F1 in the siPOU5F1/synMYOD1-transfected cells at day 3 post transfection. MYOD1 was detected by the specific antibody. The H3 antibody was used as a loading control. The relative intensities of POU5F1 signals normalized by H3 were compared between no transfection and siPOU5F1/synMYOD1 transfection (mean ± SEM from three independent biological replicates). *P < 0.01, t-test. (d) ChIP analysis showing POU5F1 enrichment at the promoter regions (Pro-1 and Pro-2) of POU5F1 in hESCs, siControl/synMYOD1-treated cells, and siPOU5F1/synMYOD1-treated cells. The promoter regions of MEF2C and MYOG were used as negative controls. The error bars indicate the SEM from three independent biological replicates. *P < 0.05, t-test. (e) ChIP analysis showing MYOD1 enrichment at the promoter regions of MEF2C and MYOG in hESCs, siControl/synMYOD1-treated cells, and siPOU5F1/synMYOD1-treated cells. mRNA encoding HA-tagged MYOD1 and anti-HA antibody was used in this experiment as the anti-MYOD1 antibody suitable for ChIP was not available. The promoter regions of POU5F1 were used as negative controls. The error bars indicate the SEM from two independent biological replicates. *P < 0.05, t-test. NS: not significant. (f) qPT-PCR analysis for the expression of myogenic markers in the siControl (siC), siPOU5F1 (siP), siC/synMYOD1, and siP/synMYOD1-treated cells. The expression levels were normalized to GAPDH. The error bars indicate the SEM from two independent biological replicates. *P < 0.01, t-test. Uncropped images of the blots for Fig. 2c are shown in Supplementary Figure 7.

