Figure 3.
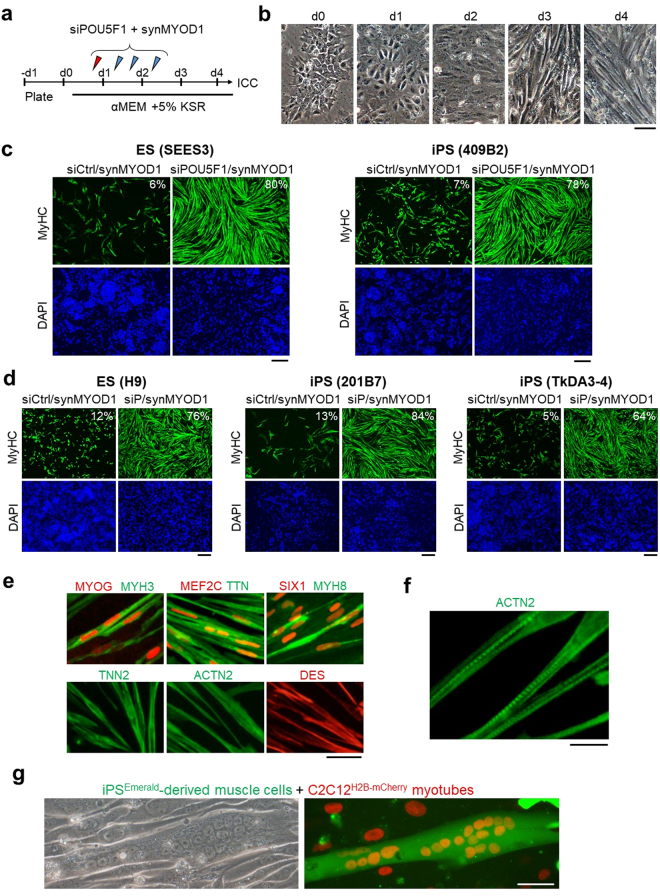
siPOU5F1/synMYOD1 treatment induces efficient myogenic conversion of hPSCs. (a) Schematic of the myogenic differentiation protocol. hPSCs were transfected with siPOU5F1 together with synMYOD1 at the indicated time points. The mixture of siPOU5F1/synMYOD1 was transfected on day 0. synMYOD1 was transfected on days 1 and 2. The cells were cultured in αMEM + 5% KSR. (b) Morphological changes in the transfected cells. Scale bar, 50 μm. (c) Immunostaining analysis for MyHC in the hPSCs (SEES3 ESCs and 409B2 iPSCs) after the treatment with siControl/synMYOD1 or siPOU5F1/synMYOD1. Nuclei were stained with DAPI. The representative images are shown. The average percentages of MyHC-stained cells are obtained from three independent biological replicates. Scale bar: 200 μm. (d) Immunostaining analysis for MyHC in the hPSCs (H9 ESCs, 201B7 iPSCs, and TkDA3-4 iPSCs) after treatment with siControl/synMYOD1 or siPOU5F1/synMYOD1. Nuclei were stained with DAPI. The representative images are shown. The average percentages of MyHC-stained cells are obtained from three independent biological replicates. Scale bar: 200 μm. (e) Immunostaining analysis for MYOG, MEF2C, SIX1, MYH3, MYH8, titin (TTN), troponin T (TNN2), actinin alpha 2 (ACTN2), and desmin (DES) in the siPOU5F1/synMYOD1-treated cells. Scale bar: 50 μm. (f) Higher magnification of ACTN2 staining. Scale bar: 20 μm. (g) 409B2-iPSCs expressing Emerald GFP were differentiated into myogenic cells and co-cultured with mouse C2C12 myotubes, nuclei of which were labeled with red fluorescence. Next day after co-culturing, cell fusions were detected. Scale bar: 50 μm.

