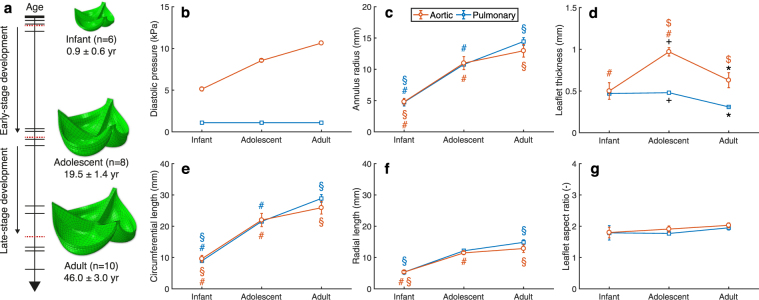
Figure 1.
Age-dependent changes in human heart valves. (a) A timeline of experimental data of 24 paired human aortic and pulmonary heart valves (where each horizontal bar represents the age of one pair) were assigned to three age groups: infant, adolescent and adult (where the red dashed bars indicate the average age of each group). The age-dependent data informed the generation of a finite element model for each group. Temporal changes were considered in diastolic blood pressure19–21 (b), annulus radius (c), leaflet thickness (d), circumferential (e) and radial (f) leaflet length, and aspect ratio between the circumferential and radial length (g)14,18. Significant differences (p < 0.05) of geometrical measurements (c–g) between groups are indicated by paired symbols.

