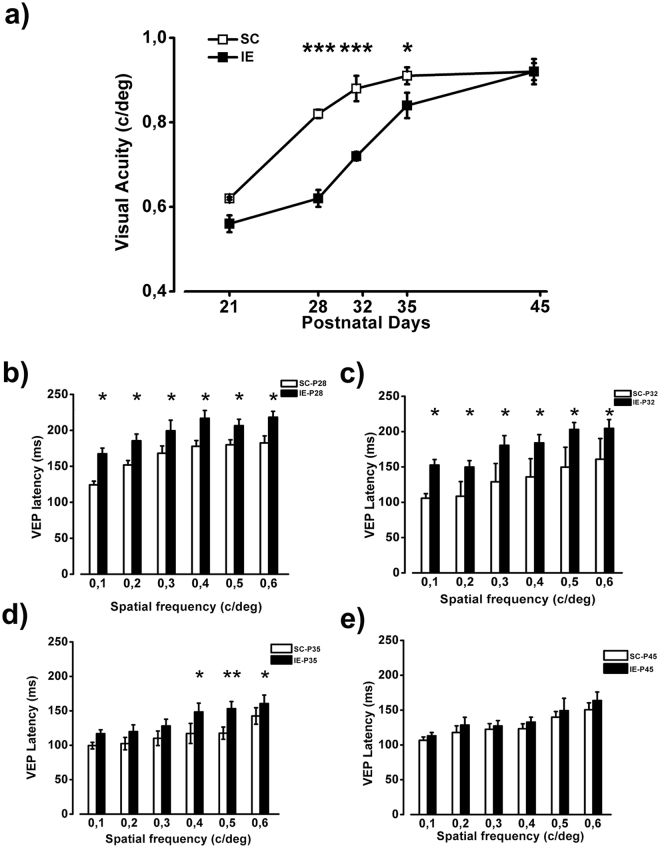
Figure 2.
Delayed functional maturation of visual cortex in IE rats. (a) Visual acuity (VA) of IE animals was significantly decreased compared to that of SC rats at P28 (SC P28, n = 6; IE P28, n = 6; Two Way ANOVA, post-hoc Holm-Sidak method, p < 0.001), P32 (SC P32, n = 5; IE P32, n = 7; p < 0.001) and P35 (SC P35, n = 5; IE P35, n = 6, p < 0.05) but not at P21 (SC P21, n = 3; IE P21, n = 6; Two Way ANOVA, post-hoc Holm-Sidak method, p = 0.09) and P45 (SC P45, n = 6; IE P45, n = 5; post-hoc Holm-Sidak method, p = 0.81). Symbols represent average VA values ± SEM. Error bars are smaller than the size of the symbols for some data points. (b,c) At P28 and P32 VEP latency of IE rats was increased with respect to SC animals at 0.1 c\deg, 0.2 c\deg, 0.3 c\deg, 0.4 c\deg, 0.5 c\deg and 0.6 c\deg (Two way RM ANOVA, post-hoc Holm-Sidak method, p < 0.05 for all comparisons). (d) At P35 P100 latency of IE rats was increased with respect to SC animals at 0.4 c\deg, 0.5 c\deg and 0.6 c\deg (Two way RM ANOVA, post-hoc Holm-Sidak method, p < 0.05 for all comparisons, except for p < 0.01 at 0.5 c/deg). e) VEP latencies at P45 were not different between SC and IE animals (Two way RM ANOVA, p = 0.42). Histograms represent latency average values ± SEM. *p < 0.05; **p < 0.01; ***p < 0.001.

