
Figure 4.
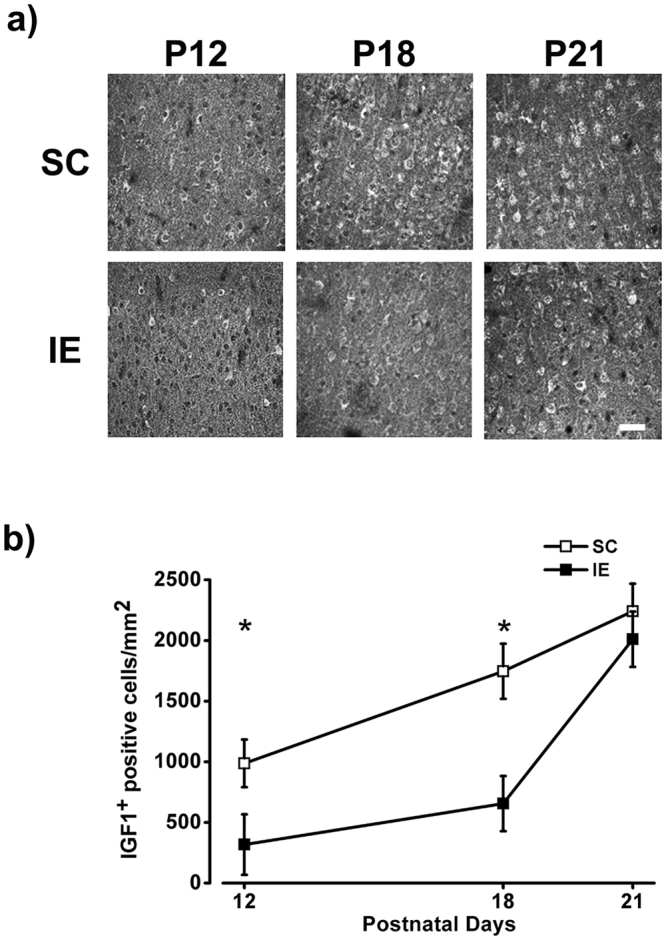
IE affects IGF-1 expression in the visual cortex. (a) Representative examples of IGF-1 labeling from fields taken in the layers V/VI of the visual cortex of SC and IE rats at P12, P18 and P21. Calibration bar: 50 µm. (b) Number of IGF-1 positive (IGF-1+) cells/mm2 in the visual cortex of SC and IE animals. IGF-1+ cell density was lower in IE animals at P12 (SC P12, n = 7; IE P12, n = 4) and P18 (SC P18, n = 6; IE P18, n = 6; Two Way ANOVA, post-hoc Holm-Sidak method, p < 0.05 for both comparisons). The number IGF-1+ cells did not differ between SC and IE at P21 (SC P21, n = 5; IE P21, n = 5; Two Way ANOVA, post-hoc Holm-Sidak method, p = 0.48). Symbols represent average values ± SEM. *p < 0.05.