
Figure 5.
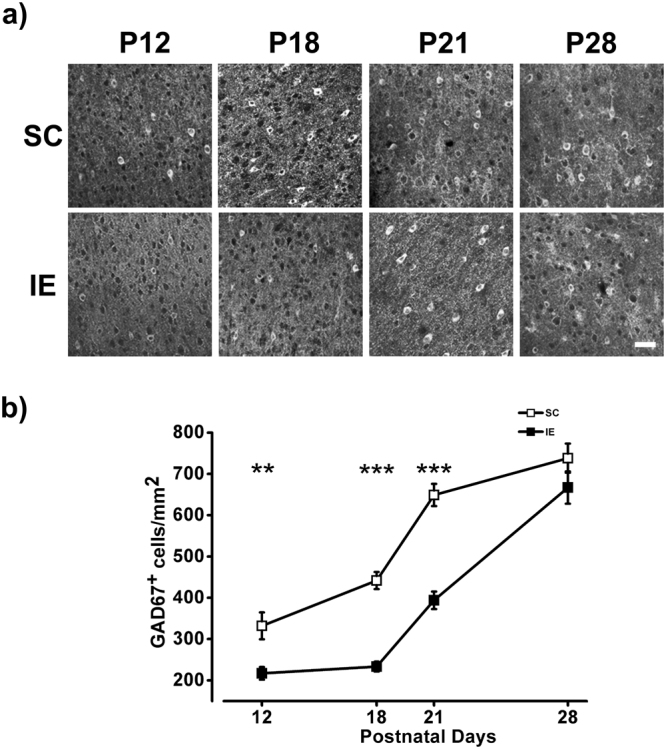
IE affects the density of inhibitory neurons in the visual cortex (a) Representative fields of GAD67 labeling taken in the layers V/VI of the visual cortex of SC and IE rats at P12, P18, P21 and P28. Calibration bar: 50 µm. (b) Quantification of GAD67 levels, in terms of number of GAD67 positive (GAD67+ cells/mm2), in the visual cortex of SC and IE animals. GAD67+ cell density was lower in IE animals at P12 (SC P12, n = 4; IE P12, n = 4; Two Way ANOVA, post-hoc Holm-Sidak method, p < 0.01), P18 (SC P18, n = 6; IE P18, n = 6; p < 0.001) and P21 (SC P21, n = 3; IE P21, n = 3; p < 0.001). The number GAD67 positive cells did not differ between SC and IE at P28 (SC P28, n = 3; IE P28, n = 3; Two Way ANOVA, post-hoc Holm-Sidak method, p = 0.1). Symbols represent average values ± SEM. **p < 0.01; ***p < 0.001.