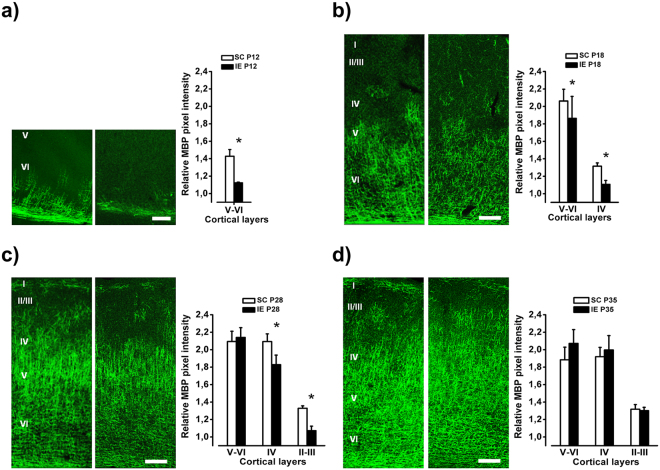
Figure 6.
IE delays axonal myelination in the visual cortex. (a) Left: Example of MBP labeling from fields taken in layers V/VI of the visual cortex of P12 SC and IE rats. Calibration bar: 50 μm. Right: Quantitative analysis of MBP immunofluorescence intensity in layers V/VI of the visual cortex of P12 animals. SC animals showed higher MBP expression in comparison to IE animals in the layers V/VI (SC P12, n = 4; IE P12, n = 6; Mann-Whitney Rank Sum Test, p < 0.05). (b–d) Left: Example of MBP labeling from fields taken through all layers of the visual cortex in P18, P28 and P35 SC and IE rats. Calibration bar: 100 μm. Right: Quantitative analysis of MBP immunofluorescence intensity in all layers of the visual cortex of P18, P28 and P35 animals. At P18 SC animals showed higher MBP immunofluorescence in layers V/VI and IV (SC P18, n = 5; IE P18, n = 6; Two way RM ANOVA, Post-hoc Holm-Sidak method, p < 0.05). At P28 SC animals showed higher MBP expression in comparison to IE animals in the layers IV and II-III (SC P28, n = 6; IE P28, n = 6; Two way RM ANOVA, Post-hoc Holm-Sidak method, p < 0.05). The layers V-VI were completely myelinated and MBP expression did not differ between groups (p = 0.74). At P35 MBP immunofluorescence did not differ between SC and IE animals in any cortical layer (SC P35, n = 5; IE P35, n = 6; Two way RM ANOVA, p = 0.63). Histograms represent average values ± SEM. *p < 0.05.

