Figure 7.
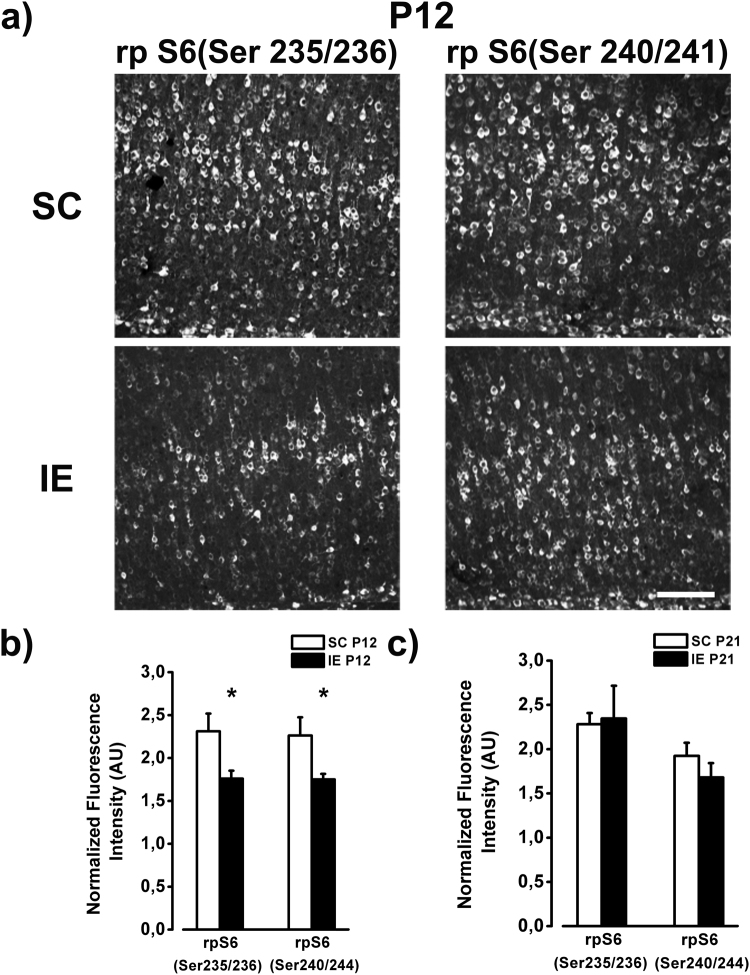
Hypophosphorylation of rpS6 in IE brain. (a) Example of rp S6 labeling (Ser235/236 and Ser 240/241) from fields taken in the layers V/VI of the visual cortex of P12 SC and IE rats. Calibration bar: 100 µm. (b) Quantitative analysis of rp S6 immunofluorescence intensity in the visual cortex of P12 animals. SC animals showed higher rpS6 expression in comparison to IE animals both for the site Ser235/236 and for the site Ser240/244 (SC P12, n = 5; IE P12, n = 5, Two way ANOVA, post-hoc Holm-Sidak method, p < 0.05). (c) At P21 rp S6 expression did not differ between SC and IE animals (SC P21, n = 5; IE P21, n = 6; p = 0.48). Histograms represent average values ± SEM. *p < 0.05.

