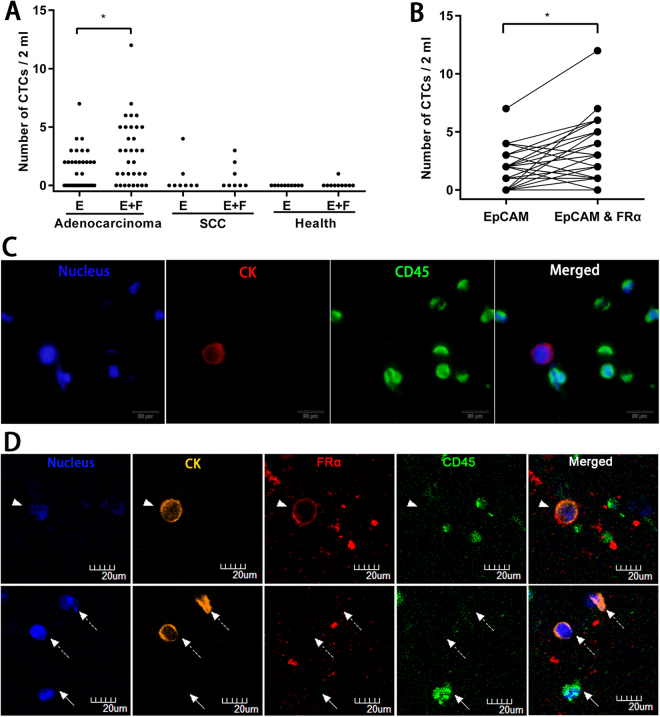
Figure 3.
(A) CTC levels of 33 adenocarcinoma patients, 8 squamous cell carcinoma patients, and 10 healthy donors identified by anti-EpCAM-MNs or a combination of anti-EpCAM-MNs and anti-FRα-MNs. (B) Paired comparison shows the number of CTCs detected by anti-EpCAM-MNs or a combination of anti-EpCAM-MNs and anti-FRα-MNs. (C) Fluorescence microscopic images of cells isolated from NSCLC patients and identified with the three-color Immunofluorescent staining. The cells were stained with Alexa Fluor® 568-labeled anti-CK19 monoclonal antibody (red), Alexa Fluor® 488-labeled anti-CD45 monoclonal antibody (green), and DAPI (blue). The cells with CK19-positive (red) and DAPI-positive (blue) but CD45-negative (green) phenotypes were enumerated as CTCs. (D) Confocal fluorescence microscopic images of cells isolated from one NSCLC patient that were identified with the three-color ICC. The cells were stained with Alexa Fluor® 568-labeled anti-CK19 (orange), Alexa Fluor® 647-labeled anti-FRα (red), and Alexa Fluor® 488-labeled anti-CD45 (green) and DAPI (blue). The captured cells contain CK+/FRα+/CD45− and CK+/FRα−/CD45− features.

