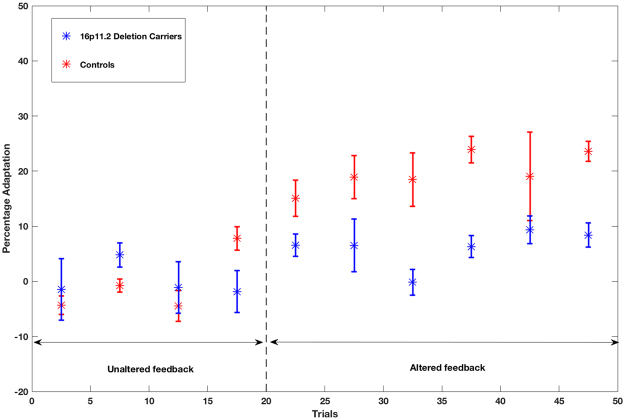
Figure 6.
Mean adaptation responses with error bars across trials grouped into bins of five trials. Significant linear effects of group and group by trial number interaction are illustrated. Following the baseline trials in which feedback was unaltered (trials 1–20), the control group demonstrated a gradual increase in adaptation with increasing number of altered feedback trials (21–50), whereas the 16p11.2 deletion group show a weaker adaptation response.

