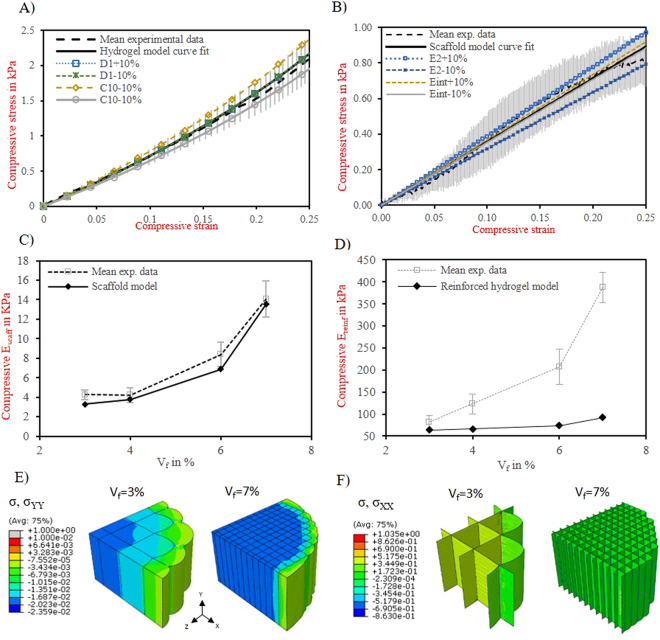
Figure 3.
Continuum FE model results under uniaxial compression. (A) Fit between mean experimental stress-strain curves of hydrogel matrix (dashed black line) and hydrogel FE prediction (solid black line). Sensitivity analysis of the fitted hydrogel material parameters: D1+10% (dotted blue line); D1–10% (dashed green line, C10+10% (dashed orange line), C10–10% and comparison with experimental stress-strain curves. (B) Fit between mean experimental stress-strain curves of the reinforcing scaffold with vf 3% (dashed black line) and respective scaffold FE prediction (solid black line). Sensitivity analysis of the fitted fibre scaffold material parameters: E2 + 10% (dotted blue line); E2–10% (dashed blue line), Eint + 10% (dashed orange line) and Eint −10% (solid grey line). Error bars represent the experimental standard deviation of a given stress value (n = 5). (C) Comparison of the predicted and experimental stiffnessess for the different fibre scaffolds alone (Escaff) as a function of their fibre volume fraction. (D) Comparison of the predicted and experimental stiffnessess for the reinforced constructs (Ereinf) under compression loading, as a function of the fibre volume fraction, vf. Fibre diameter considered Ø = 20 µm. Distribution of the (E) transversal and (F) longitudinal stress for the reinforced construct and fibre scaffold, respectively, for the volume fraction of 3 and 7%. Stress is in MPa.

