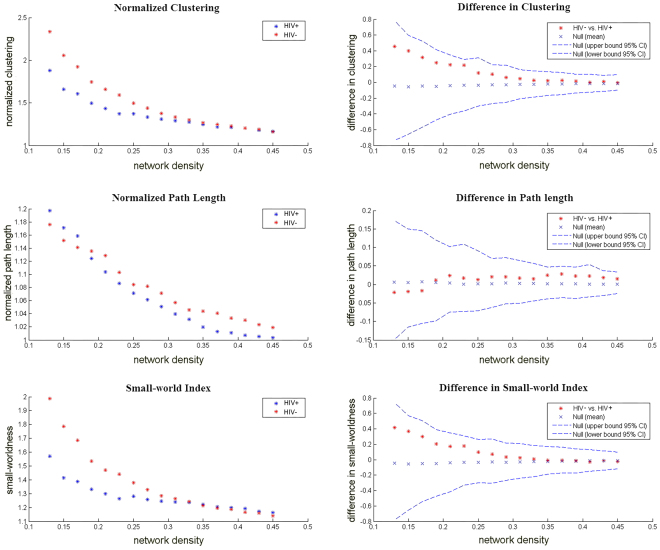
Figure 3.
Changes in global network measurements and intergroup differences as a function of network density. HIV+ and HIV− networks’ normalized clustering (left top), normalized path length (left middle), and small-world index (left bottom). The intergroup differences and 95% confidence intervals in the normalized clustering (right top), normalized path length (right middle) and small-world index (right bottom). The difference is indicated by the red marker between the HIV− and HIV+ networks.

