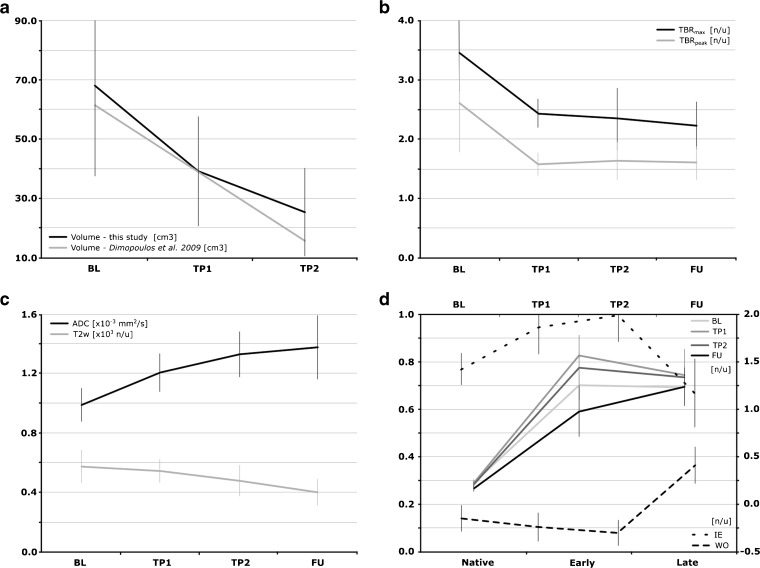
Fig. 1.
Median values of GTV volume and various imaging parameters including standard deviation at each time-point. a Tumor volume in comparison to ref. [30]. b TBRs. c T2w intensity and ADC. d IE and WO as well as enhancement curves of the T1w imaging with contrast (native, early, and late phases). BL, TP1, TP2, and FU—scan time-points: baseline, 2 and 5 weeks after EBRT start, follow-up (week 19); TBR max (SUVmax in GTV)/(SUVmean in gluteal muscle), TBR peak (SUVpeak in GTV)/(SUVmean in gluteal muscle); GTV gross tumor volume, SUV peak standard uptake value measured in a 1-cm3 sphere around SUVmax, ADC apparent diffusion coefficient, T2w T2 weighted MRI, IE initial enhancement defined as (I DCE early − I DCE native)/(I DCE native), WO wash-out rate defined as (I DCE delayed − I DCE early)/(I DCE native).

