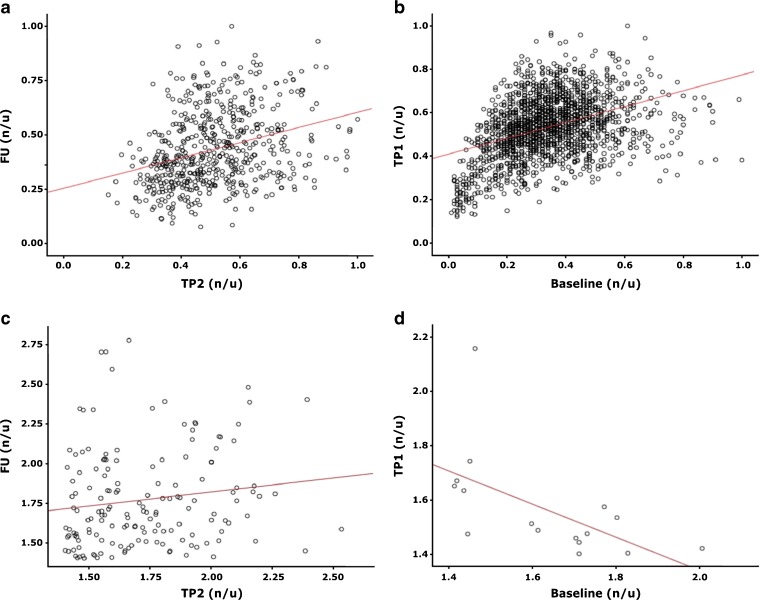
Fig. 3.
Scatter plots from different patients showing the correlation between SUV values determined in the GTV in two neighboring time-points. a–b Normalized to SUVmax at the respective time-point. c–d TBR limited to voxels with TBR >1.4. a Correlation of 0.34 (patient 6). b Correlation of 0.38 (patient 2). c Correlation of 0.16 (patient 6). d Correlation of −0.63 (patient 3). TP1, TP2, and FU—scan time-points: 2 and 5 weeks after EBRT start, follow-up (week 19); SUV standard uptake value, GTV gross tumor volume, TBR (SUV in GTV)/(SUVmean in gluteal muscle).

