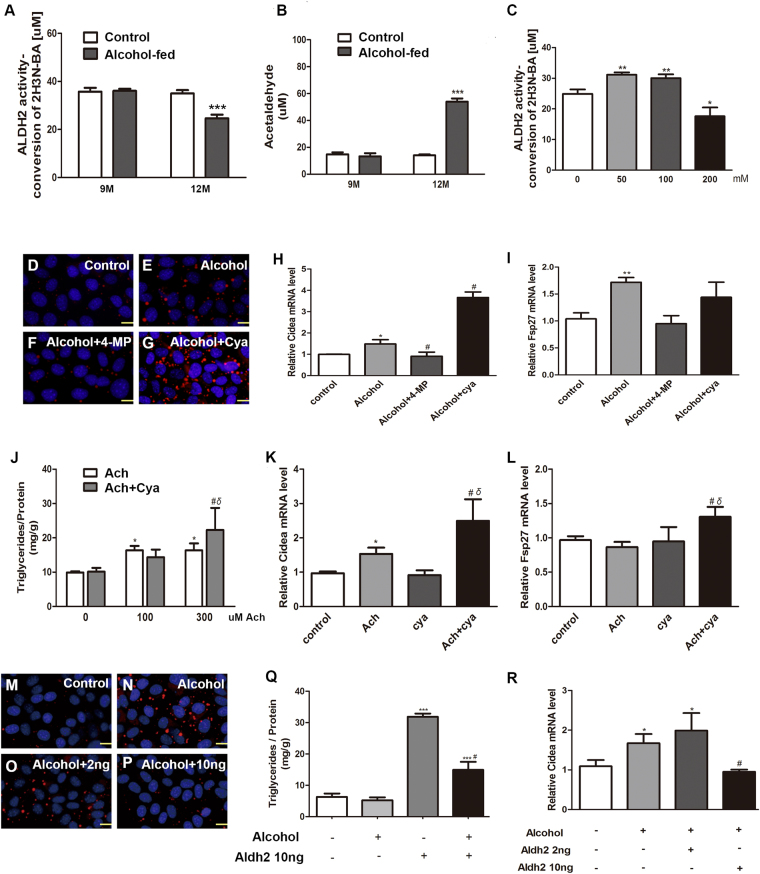
Figure 3.
Cidea is directly induced by acetaldehyde but not by alcohol. (A) Activity of ALDH2 in liver tissue, ***p < 0.001 vs. control group. (B) Concentration of serum acetaldehyde, ***p < 0.001 vs. control group. (C) Activity of ALDH2 in AML12 cells were treated with different concentration alcohol, *p < 0.05; **p < 0.01. AML12 cells were treated with alcohol, 4-methylpyrazole (0.1 mM 4-MP), or cyanamide (0.1 mM Cya) for 48 h. (D–G) Nile red staining (X200). (H) Cidea mRNA level and (I) Fsp27 mRNA level were measured. Means ± SD, n = 3, *p < 0.05 vs. control group; **p < 0.01 vs. control group; #P < 0.05 vs. Alcohol group; NS, not significant. AML12 cells were treated with 100 uM and 300 uM of acetaldehyde or cyanamide (0.1 mM Cya). (J) Triglyceride contents were measured. Means ± SD, n = 3, *p < 0.05 vs. control group; #P < 0.05 vs. cya group; δ < 0.05 vs. 300 uM Ach group. AML12 cells were treated with 100 uM acetaldehyde or cyanamide (0.1 mM Cya) for 48 h. (K) Cidea mRNA level and (L) Fsp27 mRNA level were measured. Means ± SD, n = 3, *p < 0.05 vs. control group; #P < 0.05 vs. cya group; δ < 0.05 vs. Ach group. AML12 cells were treated with alcohol and 2 ng or 10 ng of the Aldh2 protein for 48 h. (M–P) Nile red staining (X200) and (Q) Triglyceride contents and (R) qPCR analysis of the Cidea mRNA level were measured. Means ± SD, n = 3, *P < 0.05 vs. control group; ***P < 0.001 vs. control group; #P < 0.05 vs. Alcohol group.

