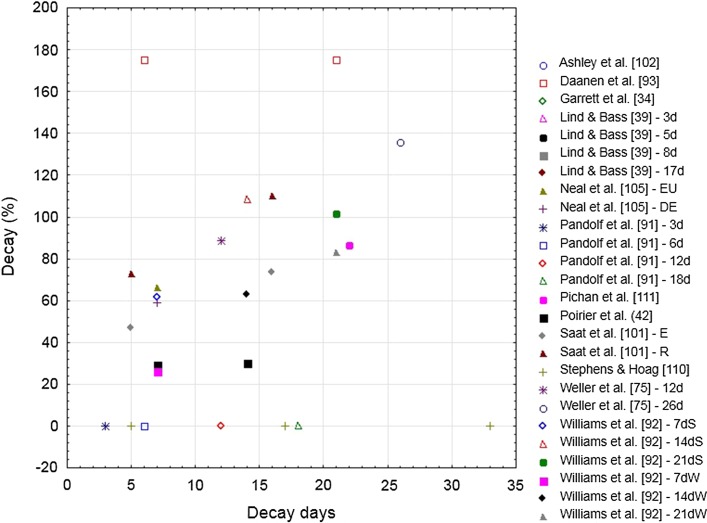
Fig. 8.
Decay (%) in the sweat rate adaptation following heat acclimation relative to the number of decay days (i.e., without heat exposure) for selected studies. Studies that appear more than once in the figure are longitudinal studies in which heat acclimation decay was tested multiple times in a single heat acclimation group. d days after heat acclimation, DE dehydration, E exercise, EU euhydration, R rest, S summer, W winter

