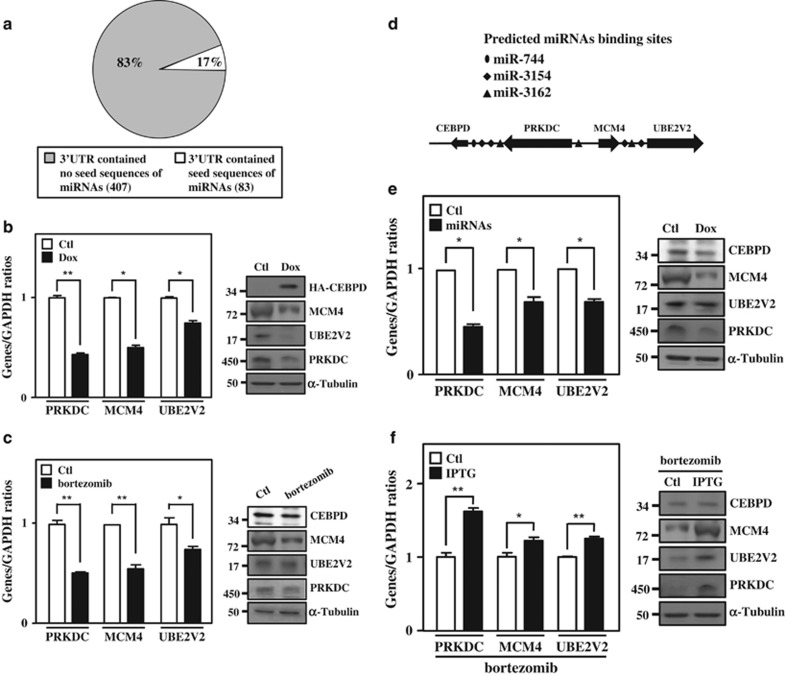
Figure 3.
CEBPD and responsive miRNAs contribute to the inactivation of the surrounding genes. (a) The 3′-UTRs of most CEBPD-downregulated mRNAs are not targeted by CEBPD-upregulated miRNAs. The CEBPD-upregulated miRNAs and -downregulated mRNAs microarray profiling was analyzed using the miRTar prediction program. The pie chart presents the percentage of CEBPD-downregulated mRNAs in the 3′-UTR, containing the seed sequences of CEBPD-upregulated miRNAs. (b) CEBPD participates in the inactivation of the surrounding genes. THP-1 cells with the Dox-inducible CEBPD expression system were treated with Dox (1 μg/ml) for 18 h; total RNA was harvested to perform qPCR (left panel), and total protein was harvested to perform western blot analysis (right panel). (c) Bortezomib represses the expression of PRKDC, MCM4 and UBE2V2. After treating with bortezomib (50 nM) for 16 h, total RNA was harvested to perform qPCR (left panel) and total protein was harvested to perform the western blot analysis (right panel). (d) Schematic representation showing the location of genes and putative miRNA-binding motifs. (e) miR-744, miR-3154 and miR-3162 reduces CEBPD surrounding genes. THP-1 cells with the Dox-inducible miR-744, miR-3154 and miR-3162 expression system were treated with Dox (1 μg/ml) for 18 h. Total RNA was harvested to perform qPCR (left panel), and total protein was harvested to perform the western blot analysis (right panel). (f) Attenuated CEBPD reverses bortezomib-inhibited gene expression in THP-1 cells. THP-1 cells with the IPTG-inducible CEBPD knockdown system were pretreated with IPTG (500 μM) for 3 h. After treatment with bortezomib (50 nM) for 16 h, total RNA was harvested to perform qPCR (left panel) and total protein was harvested to perform the western blot analysis (right panel). The data are presented as the mean±standard error of experiments performed in triplicate (*P<0.05, **P<0.01, Student’s t-test)

