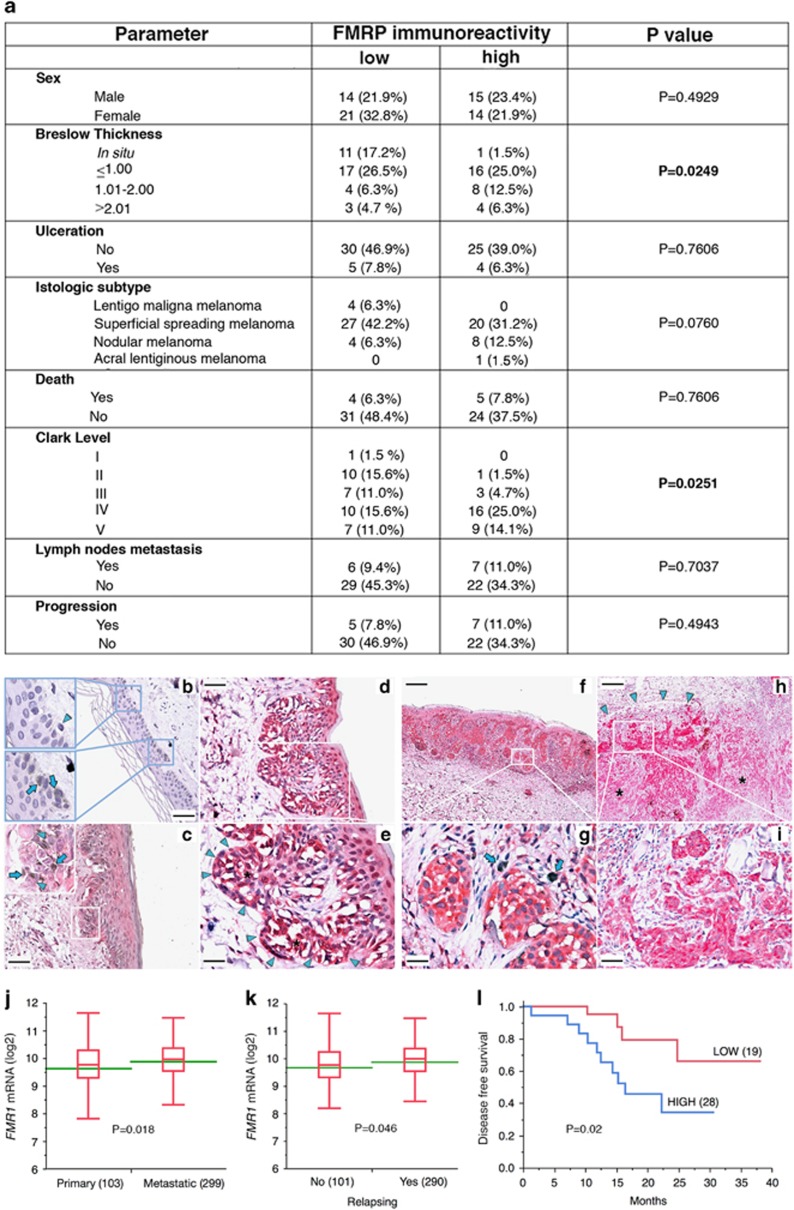
Figure 1.
FMRP is highly expressed in human melanoma with higher Breslow thickness. (a) Correlation between FMRP immunoreactivity and different parameters analyzed in a cohort (n=64) of human melanoma. FMRP-specific antibodies were described in Luca et al.18 and Ferrari et al.29 The number of cases with weak-moderate FMRP level (FMRP-IHC≤1) and high level of FMRP (FMRP-IHC>1), as well as the percentage of FMRP-positive cases (%) is reported in each patient subgroup together with a summary of clinical–pathological parameters. FMRP correlated with high Breslow thickness and high Clark level (P=0.0249 and P=0.0251, respectively). (b-i) Representative images of FMRP immunoreactivity in normal skin and in three different histological subtypes of melanoma. FMRP immunoreactivity was low in melanocytes from normal skin (arrowheads) (b). FMRP-positive neoplastic cells (arrowheads) were observed in in situ melanoma (ISM) (c), SSM (d-g) and NM (h and i), and where the higher Breslow index was observed, the higher level of FMRP expression was found. Breslow (d and e)=0.3 mm; Breslow (f and g)=0.69 mm; Breslow (h and i)=5 mm. Increased FMRP positivity was frequently found at the periphery of neoplastic nests in SSM (d and e, high power field, arrowheads) and at the invasive front in NM (arrowheads, h and i, high power field), compared with other tumoral zones (asterisks). Arrows: Azure B-positive melanin granules. Original magnification: b, c and d, × 200, calibration bar 50 μm; f and h × 40, calibration bar 250 μm; high power fields: e and g × 400, calibration bar 25 μm; i × 200, calibration bar 50 μm. Counterstains: Hematoxylin and Azure B. (j-l) FMR1 mRNA expression in the skin cutaneous melanoma TCGA data set and Kaplan–Meier curves. (j), FMR1 mRNA expression analysis in primary melanoma samples and in metastatic melanoma. Box plots indicate the distribution of log 2 FMR1 mRNA expression in the two classes. Green lines represent the average FMR1 mRNA expression. P=0.018, Student's t-test. Within parentheses are the number of samples in each class. (k) FMR1 mRNA expression analysis in tumors that relapse after initial treatment (YES) or not (NO). Box plots indicate the distribution of log 2 FMR1 mRNA expression in the two classes, and green lines represent the average expression. P=0.046, Student's t-test. Within parentheses are the number of samples in each class. (l) Kaplan–Meier plot of patients with melanoma stratified by FMR1 mRNA expression level in the primary tumor (TCGA skin cutaneous melanoma data). Probability of disease-free survival (DFS) is shown for the two categories (FMR1 high and low; see Materials and Methods). Within parentheses are the number of patients in each category. P=0.02, Student's t-test

