Figure 6.
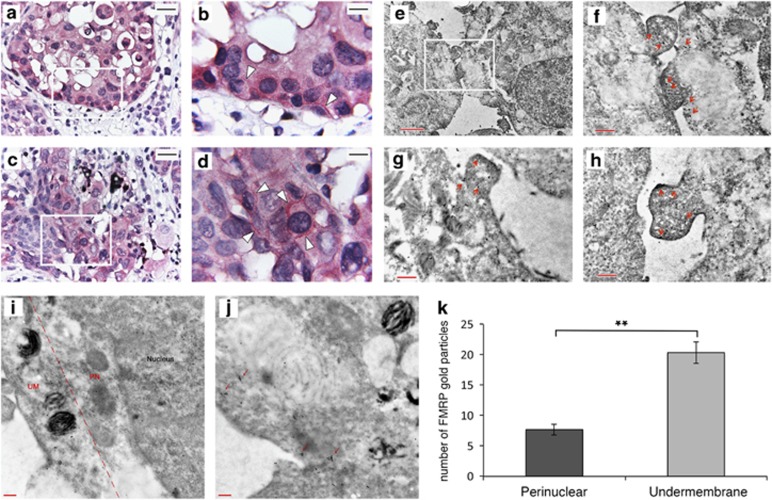
FMRP is localized at the leading edges of melanoma cells. (a-d) Representative immunohistochemical (IHC) images detecting FMRP expression in the invasive front of melanoma (a and c panels, × 400 magnification). Panel b, × 1000 magnification of the white box in panel a. Panel d, × 1000 magnification of the white box in panel c. The positivity pattern of melanoma cells is dotted, with linear gathering UM (b and d panels, see arrows). To differentiate the aspecific melanin signal from the specific FMRP immunopositivity, melanin was counterstained with Azur B (the asterisks mark the melanophages). (e-h) Representative electronic micrographics of IHC immunogold for FMRP in 501 mel cells. Panel e, × 5800 magnification of a cellular portion. Panel f, × 13 500 magnification of the white box showed in panel e. Panels g and h, × 13 500 magnifications of podosome structures localized at the leading edges of melanoma cells with FMRP-gold particles under the membrane region (red arrows in panels f-h). (i, j) Two representative immunogold EM images showing FMRP-gold particles in PN and UM regions in 501 mel melanoma cells (× 20 000 magnification). (k) Histogram showing the quantification of 5 fields of × 20 000 magnification n=20, **P<0.01, Student's t-test

