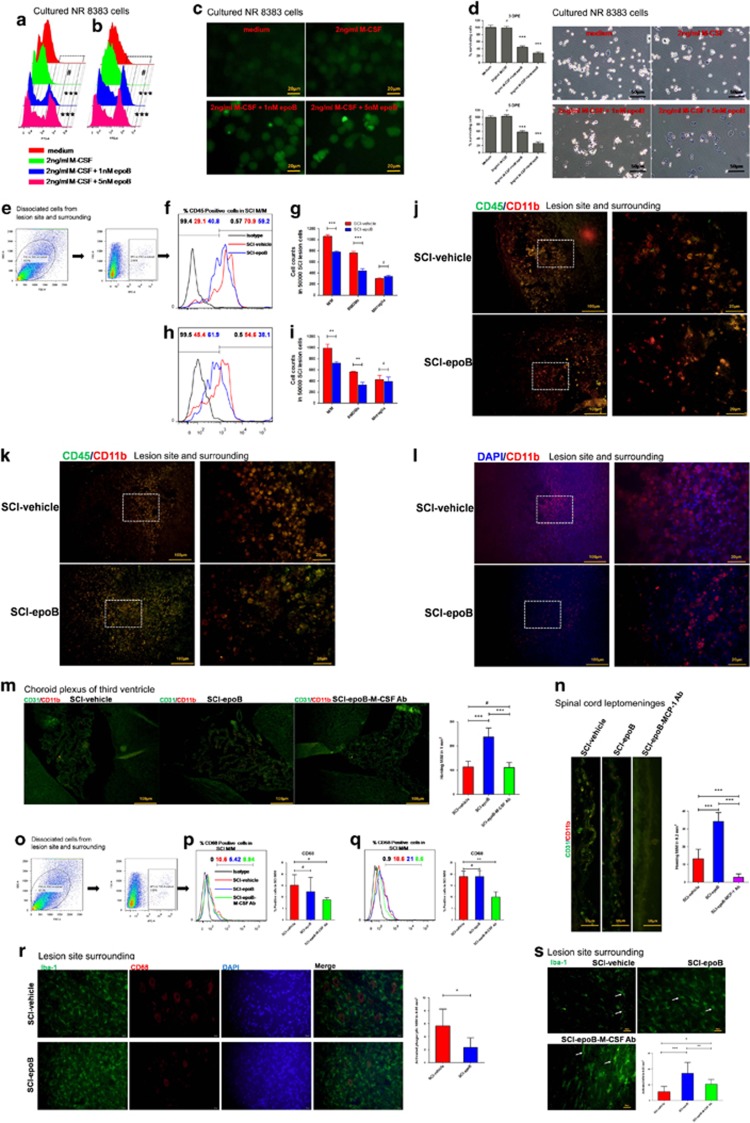
Figure 3.
SCI milieu exhibits cytotoxic to homing macrophages rather than promotes proliferation and in contrast activates microglias in acute stages after epoB treatment. (a–d) NR8383 cell line stained by CFSE was treated by M-CSF plus epoB. Either 3 (a) or 5 (b) DPE cells were analyzed by FC (Pearson's χ2 test or Fisher’s exact test). (c) Representative images of treated NR8383 cells 3 DPE. (d) Treated NR8383 cells were measured by MTT and trypan blue 3 DPE, indicating that the elevated M-CSF were unable to stimulate M/M division; however, epoB exhibits cytotoxic effects to M/M (one-way ANOVA). (e–l) SCI milieu reduces BMDMs after epoB treatment. (e) Representative plots showing the separating process of M/M in the SCI lesion. Representative plots (f) and quantification (g) of BMDMs (CD11b+ CD45+) and microglia (CD11b+ CD45−) show ~40% reduction of BMDMs in the SCI lesion milieu 3 DPE. Panels h and i show this tendency decreases 7 DPE. (j and k) Representative immunofluorescence images of BMDMs and microglias in the SCI lesion site 3 (j) and 7 (k) DPE. (l) Representative immunofluorescence images of peripheral circulation-labeled M/M in SCI lesions 3 days after epoB treatment (one-way ANOVA). (m and n) Representative immunofluorescence images and quantification of elevated M-CSF and MCP-1 recruit M/M via brain-ventricular choroid plexus (m) and SC leptomeninges (n) (Mann–Whitney U-test). (o–s) Elevated M-CSF-activated resident microglias but not homing microphages. (o) Representative plots show the separating process of M/M in the SCI lesion. Representative plots and quantification of M/M phagocytic phenotypes (CD11b+ CD68+) analyzed by FC in SCI lesions 3 (P) or 7 (q) DPE. Representative immunofluorescence images of phagocytic phenotype M/M in the SCI-vehicle and SCI-epoB 3 DPE (r). Representative immunofluorescence images of activated phenotype M/M in the SCI-vehicle and SCI-epoB 3 (s) DPE (one-way ANOVA). Mean±S.D.; n=6 per group in (e)–(k). n=3 per group in (l). n=6 per group in (m–s); (a–d) were conducted by using cultured NR8383 cell line. (e–i) were conducted by using dissociated SCI lesion site and surrounding cells (0.5 cm length SC using the lesion site as a center). (j–l) represent SCI lesion site and surrounding (using the lesion site as a center). (m) and (n) represent choroid plexus of third ventricle and SC leptomeninges, respectively. (o–q) were conducted by using dissociated SCI lesion site and surrounding cells (0.5 cm length SC using the lesion site as a center). (r) and (s) analyzed in SCI lesion surrounding of epicenter±1000 μM. *P-value <0.05; **P-value <0.01; ***P-value <0.001

