Figure 1.
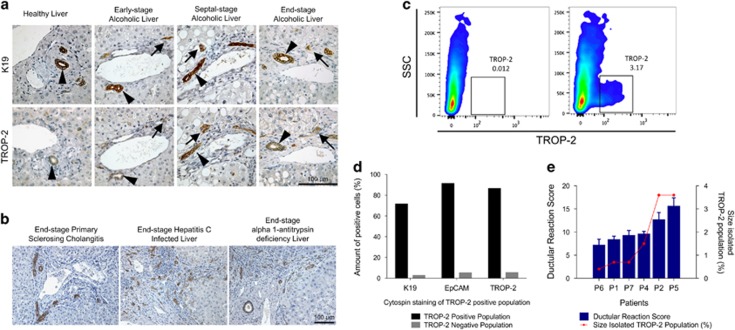
Evaluation of TROP-2 expression in human liver and isolation of TROP-2+ cells. (a) Immunohistochemical evaluation of TROP-2 in healthy, early, septal and end-stage alcoholic liver, compared with the expression of K19 (arrows = TROP-2+ ductular reaction; arrowheads = TROP-2+ cholangiocytes). (b) TROP-2 expression in other end-stage liver diseases: primary sclerosing cholangitis, hepatitis C and α1-antitrypsin deficiency. (c) FACS analysis of TROP-2+ cell population. (d) Immunohistochemical analysis of cytospins of TROP-2+ population. (e) Correlation between the ductular reaction score and percentage of the isolated population, shown for TROP-2+ populations

