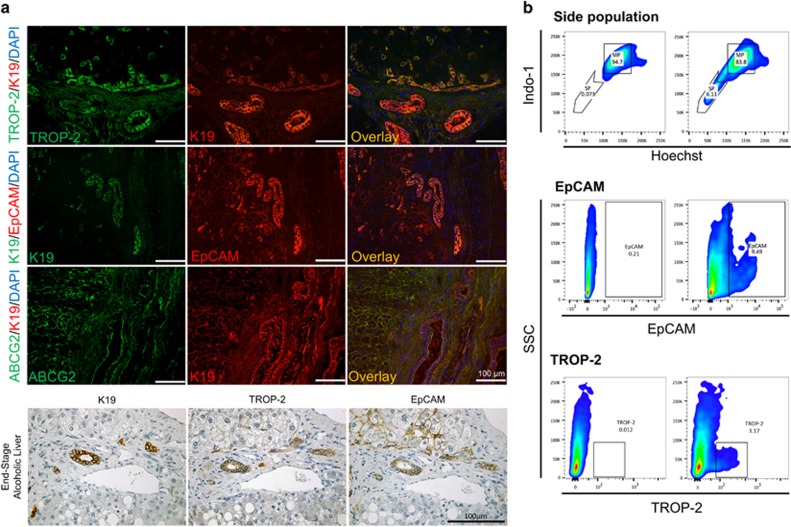
Figure 2.
Isolation and evaluation of SP, EpCAM+ and TROP-2+ population. (a) Immunofluorescent double staining of human ASH liver: TROP-2/K19, K19/EpCAM and ABCG2/K19. Immunohistochemical evaluation of K19, TROP-2 and EpCAM expression in ASH liver. (b) FACS profiles of SP, EpCAM+ and TROP-2+ populations

