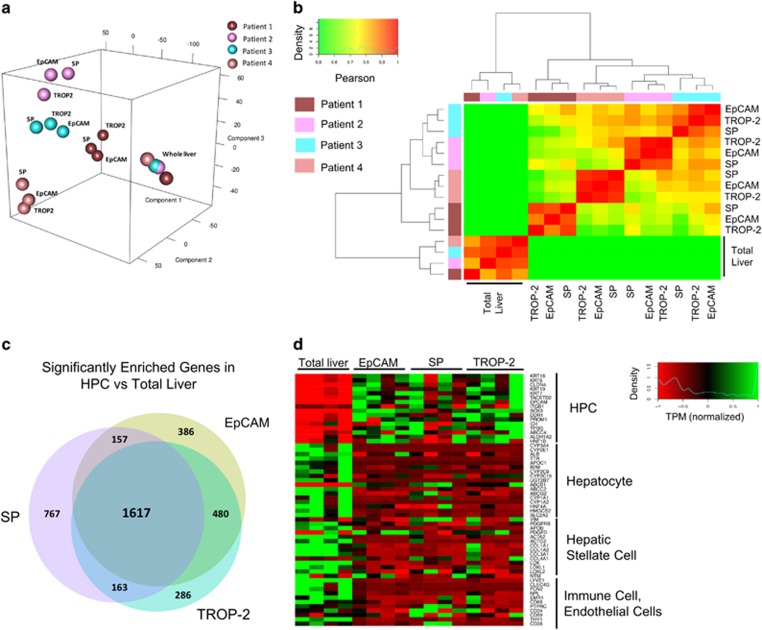
Figure 3.
Evaluation of SP, EpCAM+ and TROP-2+ population. (a) PCA analysis of the different patients and isolation methods. (b) Clustering of the different isolated groups. (c) Overview of the amount of significant enriched genes in the different isolated groups versus total liver. (d) Marker clustering analysis of different cell types in total liver versus SP, EpCAM+ and TROP-2+ population

