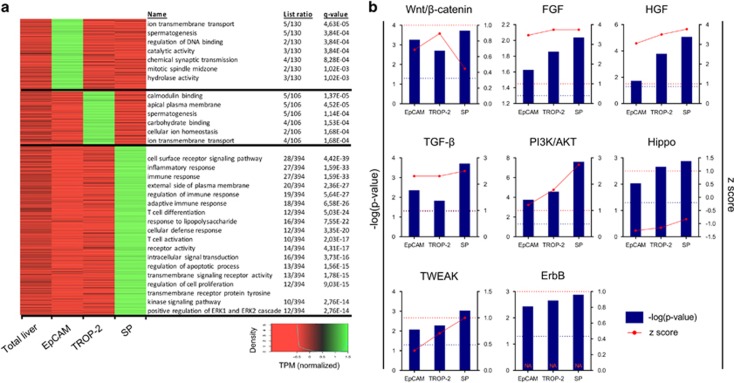
Figure 4.
Pathway analysis of differently expressed genes of the FACS isolated HPC-enriched populations. (a) Differences in significant pathways in the different HPC-enriched groups and total liver. (b) Different significant (−log(P-value)) pathways linked with HPC activation/proliferation and their activation (z-score) in the different isolated groups versus total liver. Blue dotted line=significant P-level (0.05). Red dotted line=z-score limit of 1 (z-score>1 is activation, z-score<1 is inhibition of pathway)

