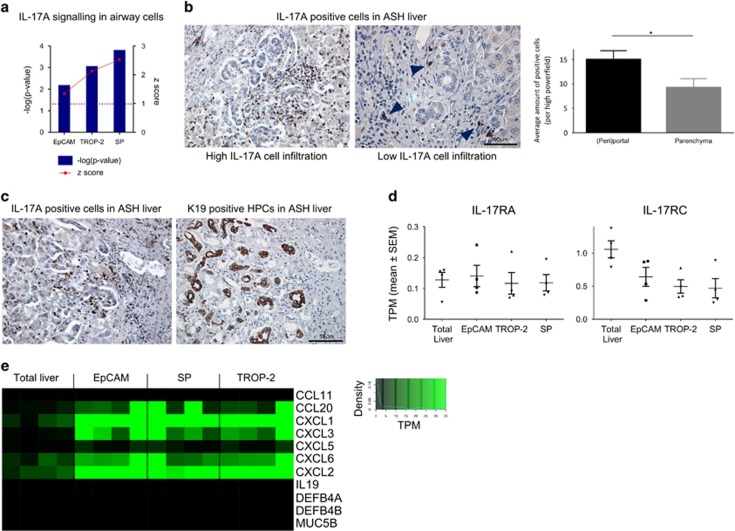
Figure 7.
Interleukin-17A (IL-17 A) pathway as a potential player in human HPC activation/proliferation. (a) Significant (−log(P-value)) IL-17 A pathway and the activation (z-score) in the different isolated groups versus total liver. Blue dotted line=significant P-level (0.05). Red dotted line=z-score limit of 1 (z-score>1 is activation, z-score<1 is inhibition of pathway). (b) Immunohistochemical evaluation of IL-17 A+ cells in alcoholic liver: high versus low (arrowheads) infiltration. Comparison of the amount of IL-17 A+ cells in (peri)portal and parenchyma regions of the liver (average amount of IL-17 A+ cells per high powerfield in parenchyma or (peri)portal region) (*P<0.05; mean±S.E.M.). (c) IL-17 A+ cells and K19+ cells in the same region on serial slices. (d) Median gene expression (TPM±S.E.M.) of IL-17RA and IL-17RC (*P<0.05; mean±S.E.M.). (e) Median gene expression of downstream targets of IL-17 A signalling in airway cells

