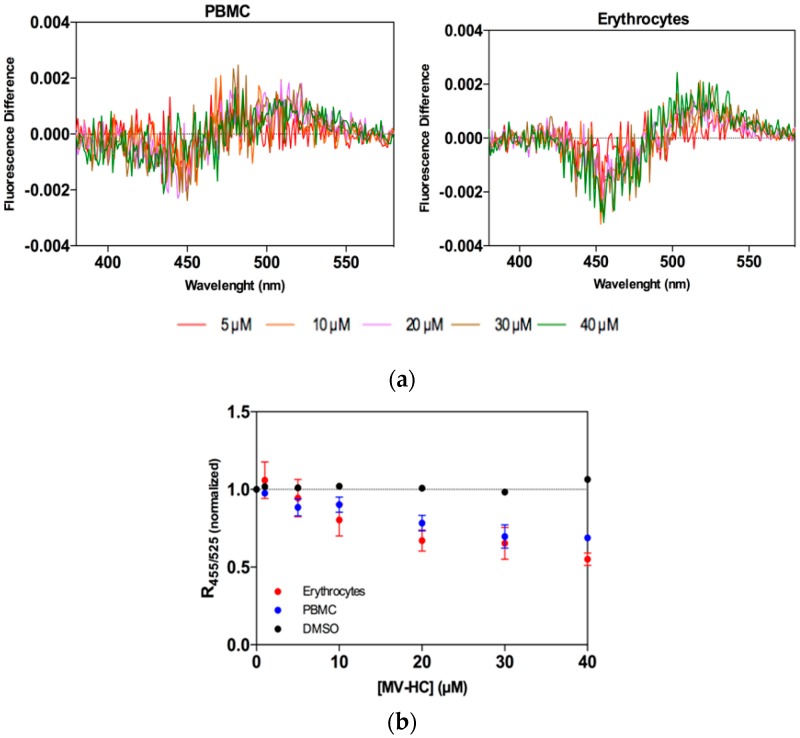
Figure 4.
Peptide affinity towards erythrocytes and PBMC assessed by di-8-ANEPPS fluorescence: (a) Differential spectra of di-8-ANEPPS bound to cells in the presence of a range of concentrations of MV–HC. Spectra were obtained by subtracting the excitation spectrum (normalized to the integrated areas) of labeled cells in the absence of peptide from those in its presence (different concentrations); (b) Binding profiles of MV–HC to erythrocytes and PBMC, obtained by plotting the di-8-ANEPPS excitation ratio, R455/525, normalized to the initial value, as a function of the peptide concentration.

