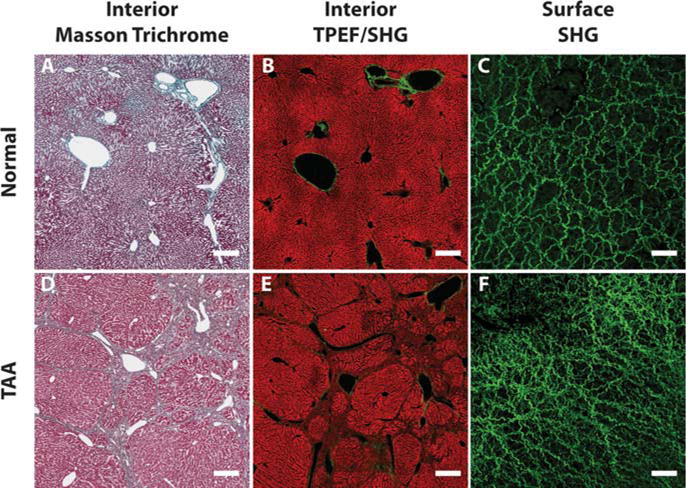
Figure 5.

Comparisons between liver interior images and liver surface images. (A) to (C) are Masson Trichrome stained interior image, TPEF/SHG interior image and SHG surface image from a normal liver, respectively. Same morphologies and structures of collagen and cells can be observed in liver interior images from both conventional staining and TPEF/SHG microscopy. The TPEF signals come from intrinsic molecules such as reduced nucleotide (NAD(P)H) and oxidized flavoproteins (Fp) which reveals the morphology of hepatocytes and cell necrosis in the liver. However, the collagen structures are totally different on the liver surface. (D) to (F) are interior and surface images from a late stage fibrotic liver of the TAA model. Both Masson Trichrome stained and TPEF/SHG interior images show the same collagen architecture changes as the bridging between portal tracts and veins. Different collagen structure changes are found on surface image, where capsule collagen fibers are denser and with smaller spaces between than normal liver. The scale bar represents 100 μm for interior images and 50 μm for surface images.
