Abstract
The myoarchitecture of the ventricular wall provides a structural template dictating tissue-scale patterns of mechanical function. We studied whether myofiber tract imaging performed with MR diffusion spectrum imaging (DSI) tractography has the capacity to resolve abnormalities of ventricular myoarchitecture in a model of congenital hypertrophic cardiomyopathy (HCM) associated with the ablation of myosin binding protein-C (MyBP-C). Homozygous MyBP-C knockout mice were generated by deletion of exons 3–10 from the endogenous MyBP-C gene. Fiber alignment in the left ventricular wall of wild type mice was depicted through DSI tractography (and confirmed by multi-slice two-photon microscopy) as a set of helical structures whose angles display a continuous transition from negative in the subepicardium to positive in the subendocardium. In contrast, the hearts obtained from the MyBP-C knockouts displayed substantial myoarchitectural disarray, characterized by a loss of voxel-to-voxel orientational coherence for fibers principally located in the mid-myocardium-subendocardium and impairment of the transmural progression of helix angles. These results substantiate the use of DSI tractography in determining myoarchitectural disarray in models of cardiomyopathy and suggest a biological association between myofilament expression, cardiac fiber alignment, and torsional rotation in the setting of congenital HCM.
Keywords: Cardiac fiber organization, Myofilament, Diffusion spectrum MRI, Cardiomyopathy
INTRODUCTION
There has long been interest in the use of structural imaging to distinguish normal and pathological cardiac myoarchitecture. Streeter et al.33 and others,12,38 determined that the organization of the highly anisotropic myocardial fibers may be conceived as crossing helical structures, whose crossing angles vary as a function of transmural depth within the ventricular wall. From these findings emerged the hypothesis that the myocardium consists of a series of nested fiber shells6,32 configured as 2D sheets bounded by collagen19 or as a continuous muscular band,35 and that contraction of these structures during systole results in a characteristic twisting motion.15,25 Similar myoarchitectural patterns have been identified employing diffusion-weighted MR techniques in rat27 and mouse34 hearts. While it is recognized that myoarchitectural imaging provides a valid “blueprint” for local mechanics, it is not known if such techniques have the capacity to discern pathological myoarchitecture in the setting of cardiomyopathy.
To address this question, we studied the ability of a highly resolved diffusion-weighted MR method, diffusion spectrum imaging (DSI) with tractography, to portray patterns of myoarchitectural disorder in a mouse model of congenital hypertrophic cardiomyopathy (HCM). Human congenital HCM is believed to be due to mutations in one of several myofilament proteins, including myosin binding protein-C (MyBP-C).8,13 MyBP-C regulates the interaction between myosin and actin principally through the phosphorylation of phosphokinase A (PKA),3,31,40,42 whereas the binding of unphosphorylated MyBP-C to myosin reduces the probability of myosin binding to actin. It has been postulated that the principal mechanism of cardiac pump failure following MyBP-C ablation is the alteration of actin–myosin binding and impaired cross bridge formation,5 yet the precise mechanisms linking MyBP-C expression, cardiac myoarchitecture, and cardiac mechanics remain uncertain. Diffusion spectrum imaging (DSI) is a novel MR imaging methodology that determines the alignment of complex fiber populations by deriving the complete 3D proton spin displacement function.10,20,40 Myofiber orientation can, in turn, be represented as a multi-voxel “tract” based on the similarity of fiber alignment existing between adjacent voxels.1,9,11 Myoarchitectural disarray derived from DSI tractography may provide a structural template dictating patterns of impaired mechanics and so imply a quantifiable, biological connection between myofilament expression and cardiac pump function.
METHODS
Generation of Knockout Mouse Preparation Exhibiting Gene Deletion of MyBP-C
Homozygous MyBP-C null mice were generated by deleting exons 3–10 from the endogenous MyBP-C gene.13 The resulting targeting vector was electroporated into 129/Sv ES cell lines and the targeted clones used to generate chimeric founder mice. Reverse transcription PCR, performed in 3′ regions of MyBP-C cDNA, confirmed the absence of MyBP-C RNA expression in MyBP-C−/− mice. The 345-bp product from exons 3 to 10 in wild type and heterozygous cDNA was not detected in homozygous MyBP-C−/− cDNA. Western blot analyses, using a polyclonal antibody against rat MyBP-C, confirmed the absence of MyBP-C in homozygous mouse hearts. Three-week-old MyBP-C−/− mice displayed cardiac hypertrophy, but survived through senescence and were fertile. No compensatory expression of skeletal MyBP-C isoforms was observed. Adult mice (8–36 weeks old) were anesthetized with isoflurane, after which their hearts were excised and fixed in buffered neutral 10% formalin. All surgical procedures performed in mice were approved by the Caritas St. Elizabeth’s Medical Center Institutional Animal Care and Use Committee (IACUC).
Diffusion Spectrum Magnetic Resonance Imaging
Diffusion spectrum magnetic resonance imaging (DSI) is based on the imaging of water molecules whose displacement is constrained by one or more biological boundary conditions.20,10 An inverse Fourier transform of q-space (q-value) produces a probability density function (PDF) for diffusing protons in a tissue per voxel:
| (1) |
where represents the 3D PDF summed over each proton spin position and weighted by the proton density distribution over diffusion time Δ, diffusion distance , and q-value . The Bloch–Torrey equations2,36 were previously modified to account for general anisotropic diffusion28,29 in order to relate to signal attenuation over the applied diffusion weighting gradient and time:
| (2) |
where γ is the proton gyromagnetic ratio. The resulting PDF may be translated into an orientation distribution function (ODF) by radial integration:
| (3) |
to depict fiber architecture as a function of fiber angle. The ODF is weighted by the magnitude ρ and unit vector of . This data set provides a probability distribution for diffusion for a set of directions, regardless of the magnitude of the diffusion, and is further normalized by subtracting the smallest magnitude value. The 3D vector directions of maximum diffusion at the scale of the voxel are provided as a function of the local maxima in the ODF. Imaging was performed using DSI tractography at 9.4T with a horizontal bore magnet (Magnex Scientific) equipped with a Magnex gradient coil set with capabilities up to 20 G/cm. The MR imaging protocol employed a diffusion gradient sampling scheme consisting of a keyhole Cartesian acquisition to include q-space values lying on a Cartesian grid within a sphere of 515 diffusion-weighted gradient vectors. The hearts were immersed in Fomblin oil prior to MR scanning and then imaged with a bmax of 4000. The approximate imaging time required to achieve a voxel size of approximately 0.16 mm was 10–12 h.
3D Microscopy Obtained from Multi-Slice Two-Photon Microscopy
In order to demonstrate the microscopic underpinnings of DSI for the indicated mouse hearts, multi-slice two photon microscopy (TPM) was employed. Following fixation and MR imaging, the specimens (approximately 1 × mm × 1 mm × 1 mm) were embedded in paraffin, cut longitudinally from base to apex along the septal wall and fixed on the sample stage. The samples were imaged at 10 frames per second for 300 × 400 pixels using a one color channel. TPM was performed with 14 fields of view (steps) in the x-direction, 18 in the y-direction, and 30 in the z-direction, denoting the principal Cartesian directions. Imaging of left ventricular wall specimens of both wild type and knockout mice was performed employing a customized multi-photon high speed imaging system set up around a Zeiss microscope (Axioscope, Zeiss Thornwood, NY) with an automated x–y specimen stage, an automated tissue cutting mechanism, and a high speed polygonal scanning mirror.10,16,24 The use of an imaging rate of 10 frames per second, 0.7 μs pixel residence time, and a 3750 rpm rotation speed resulted in a net line-scanning speed of 320 μs/line. The microscope (Axioscope, Zeiss, Thornwood, NY) was coupled with a laser beam through a modified epiluminescence light path, which directed a beam reflected by the dichroic mirror toward the objective (Zeiss 40× Fluar 1.3 numerical aperture NA). Non-spatially resolved detectors (R3896, Hamamatsu, Bridgewater, NJ) were used to collect the emitted photons. A 3D autocorrelation algorithm was performed to extract the main fiber directions per voxel in microscopic fields of view.1 Each field of view was divided into four image volumes with a voxel size 60 μm × 60 μm × 60 μm. The image volumes were linearly interpolated in the z-direction to achieve isotropic voxel resolution. Each image volume file was translated into a set of 181 equally spaced vectors on the surface of a half sphere, where a single value was extracted and recorded from the bidirectional radial integration. Through a 3D Fourier transform, the data was then displayed in a frequency space, and a frequency filter was then used to remove features/signals with wavelengths greater than or equal to 120 μm. The Fourier transform of the image volume was calculated through a component by component multiplication of its conjugate to obtain the autocorrelation and then followed by an inverse transform back into real space.
Generation of Tractography Images from DSI and TPM
DSI and TPM datasets were processed using custom software to reconstruct and visualize their 3D myoarchitecture. Myofiber tracts were constructed based on the vector directions in ODFs associated with adjacent voxels through streamline construction, whereby multi-voxel tracts are formed that follow the direction of the diffusion maxima.1,9,11 Owing to the fact that DSI allows for more than one local diffusion maxima per voxel, we employed a method of streamline generation that operates by adding a constraint that a certain angular threshold must be reached in order to create intervoxel connectivity. By convention, this constraint is defined as that condition that exists when the indicated vectors lie within an angular threshold of ±17.5°. The myofiber tract is thus derived from the principal fiber directions, represented as the directions of maximum diffusion of the set of ODFs associated with adjacent voxels. Myofiber tracts were displayed using a helix color-coding scheme, where yellow/green indicates a negative left-handed helix angle and dark blue/pink indicates a positive right-handed helix angle (reference axis longitudinal orientation, base to apex). The helix angle was determined relative to a longitudinally aligned reference axis, associating the apex of the heart to the base. A region of interest (ROI) sphere for a specified radius was employed to isolate and visualize myofibers in the myocardium. Fiber length was computed as a function of the extent of indicated myofiber tracts in terms of the numbers of voxels spanned and the length/voxel. For normalization among specimens, the average fiber lengths were divided by the maximum fiber length measured for each specimen.
RESULTS
Tractographic Imaging of the Wild Type Mouse Myocardium
Excised male mouse hearts (2 wild type, 3 MyBP-C−/−) were imaged using diffusion spectrum MRI (DSI) followed by high speed multi-slice, two photon microscopy (TPM), and all image data were processed for tractographic visualization. Employing a spherical region of interest (ROI) for localization, DSI resolved the transmural variation of myofiber tract helix angles displayed in normal mouse hearts (Fig. 1). Quantifying the variation of myofiber tract helices within the ventricular wall, the helix angles varied progressively from negative angles in the subepicardium through zero degrees in the midmyocardium to positive angles in the subepicardium (Fig. 2). The helix angles in the right ventricular wall varied similarly, although on a smaller spatial scale owing to reduced wall thickness. In order to provide microscopic confirmation of the aforementioned DSI findings, reconstruction of TPM images was performed for each heart imaged by DSI, employing the local autocorrelation function of individual oriented cells. TPM sections corresponding to the DSI tracts were isolated using ROI spheres, displaying four slices from the subepicardium to subendocardium with similar variations in tract helix angle and pattern (Fig. 3). The first epicardial slice (Figs. 3b, 3f) consisted of left-handed helices (green) and circumferential tracts (light blue). Right-handed helices (dark blue, purple) dominated as the ROI sphere was shifted toward the sub-endocardium (Figs. 3e, 3i). Myofiber helix angles constructed from DSI and TPM images employing an identical ROI sphere for localization were identical at each transmural depth (Fig. 3j).
FIGURE 1.
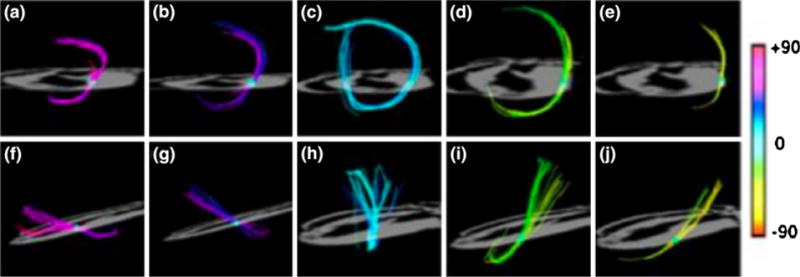
Determination of myofiber helix angles from DSI tractography. The continuous gradient of helix angles as a function of ventricular wall depth is shown. Panels (a) to (e) viewed from the apex and panels (f) to (j) viewed from the lateral wall display isolated fibers intersecting with a ROI sphere. Using helix angle color encoding, the fiber tracts along the left ventricular wall gradually transition from helices with negative angles in the subepicardium to zero degrees (circumferential) in the midmyocardium to positive angles in the subepicardium. The left-handed helices in the subepicardium point toward the base, while the right-handed helices in the subendocardium point toward the apex.
FIGURE 2.
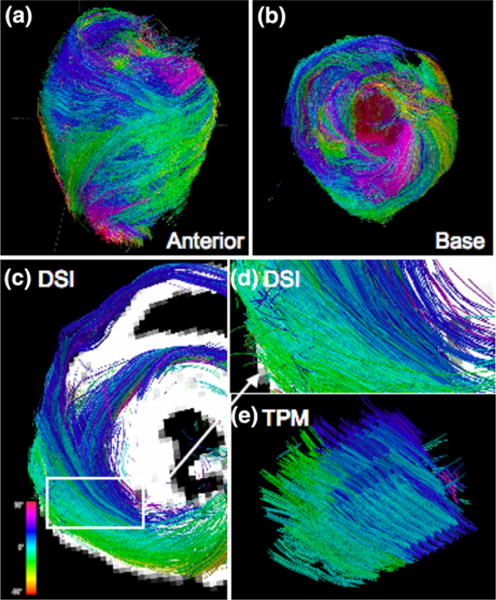
Myoarchitecture of the wild type (WT) mouse heart. DSI tractography of a WT mouse heart from the perspective of the (a) anterior wall and the (b) base of the heart. Myofiber tracts are color coded as function of helix angle (scale shown) and vary progressively from helices with negative angles in the subepicardium to zero degrees (circumferential) in the midmyocardium and to positive angles in the subepicardium. Comparison of myofiber helix angles obtained by DSI and TPM tractography is shown in terms of (c) DSI projection of isolated fibers along the left and right ventricle as viewed from the base. (d) Corresponding imaged DSI location magnified from (a) (white box). (e) TPM reconstruction of myofiber tracts showing similar helix angle variations as a function of wall depth as DSI.
FIGURE 3.
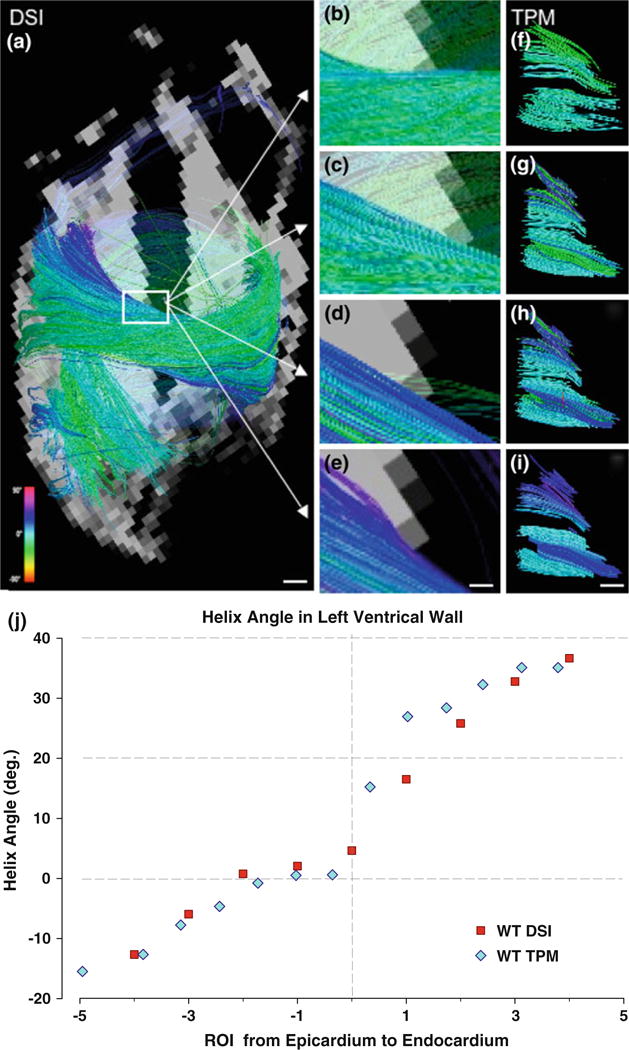
Helix angle transitions in wild type myocardium displayed by DSI and TPM tractography. (a) DSI visualization of full 2-chamber view from left ventricle of isolated myofiber tracts. White scale bar indicates 1 mm. (b–e) Enlarged DSI projections (white box from a) illustrate the same gradient of myofiber tracts from positive to circumferential to negative helix angles as (f–i) TPM images. For both (b–e) and (f–i), a ROI sphere was shifted parallel to the short axis from the subepicardium to subendocardium. White scale bar indicates 0.28 mm in (b–e), and 0.2 mm in (f–i). (j) Plot of DSI- and TPM-derived myofiber helix angle as a function of location in the left ventricular wall in the case of a wild type (WT) heart, demonstrating near equivalence of the helix angles at each transmural depth.
Tractographic Imaging of the MyBP-C−/− Mouse Myocardium
Images of the MyBP-C−/− myocardium from the anterior and basal views demonstrated variations of myofiber helix angles as a function of position within the ventricular wall (Fig. 4). The myocardial myofiber tract patterns revealed by DSI and TPM varied significantly in comparison with the myofiber tract patterns present in the wild type myocardium. Compared to wild type myocardium, the MyBP-C−/− myocardium displayed substantial myoarchitectural disarray, characterized by a loss of voxel-to-voxel orientational coherence for those fibers located principally in the mid- and endo-myocardium resulting in a loss of the predicted transmural variation of tract helix angle. This effect was quantified by comparative measurements of average fiber tract length (reflecting intervoxel angle coherence) and myofiber helix angle (reflecting the tissue pattern of myofiber alignment). The average tract length was maximal in the midwall (ROI position 0) for the wild type myocardium, whereas the average tract length for the MyBP-C−/− myocardium was minimal at this position (Fig. 5). Displayed in Fig. 6 are subepicardial and subendocardial myofiber tracts isolated by the same ROI sphere in wild type and MyBP-C−/− hearts. Comparing the subendocardial region of the tissue, both wild type and MyBP-C−/− hearts exhibit coherent fiber tracts, although with different helix angles. In contrast, comparing the subepicardial region of the tissue, the wild type hearts exhibit coherent fiber tracts, whereas the MyBP-C−/− hearts exhibit a near complete lack of fiber coherence. Myofiber helix angle was plotted as a function of wall depth in both MyBP-C−/− and wild type hearts (Fig. 6e). In comparison with the wild type myocardium, the myofiber tracts of the MyBP-C−/− myocardium displayed a near absence of discernible tracts in the midwall and subendocardium due to a lack of coherence organization. Considering the region of the subepicardium to the midwall, the MyBP-C−/− myocardium displayed a more rapid transition from left-handed helices to circumferential helices (negative ROI positions).
FIGURE 4.
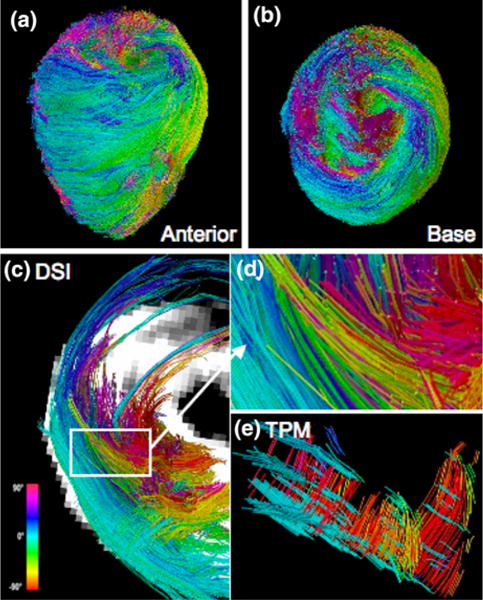
Myoarchitecture of MyBP-C−/− (KO) mouse heart. DSI tractography of the heart obtained from a MyBP-C knockout mouse heart from the perspective of the (a) anterior wall and the (b) base of the heart, with myofiber tracts color coded by helix angle. Unlike the wild type mouse heart, the variation from subepicardium to subendocardium does not remain consistent around the circumference of the heart. The circumferential (light blue) and negative (dark blue and pink) fibers appear in the epicardium to midmyocardium, rather than the endocardium. Comparison of DSI and TPM tractography of a MyBP-C−/− heart is demonstrated in terms of: (c) DSI projection of left and right ventricle from a basal view. (d) Enlarged DSI image of tracts (white box (a)) corresponding to the imaged TPM location. (e) TPM reconstruction of fibers showing similar helix angle variations as DSI. The myofiber tracts in the MyBP-C−/− hearts imaged with both DSI and TPM (compared with wild type hearts shown in Fig. 1) display architectural disarray manifested by a paucity of myofiber tracts and variation in transmural helix angle transition.
FIGURE 5.
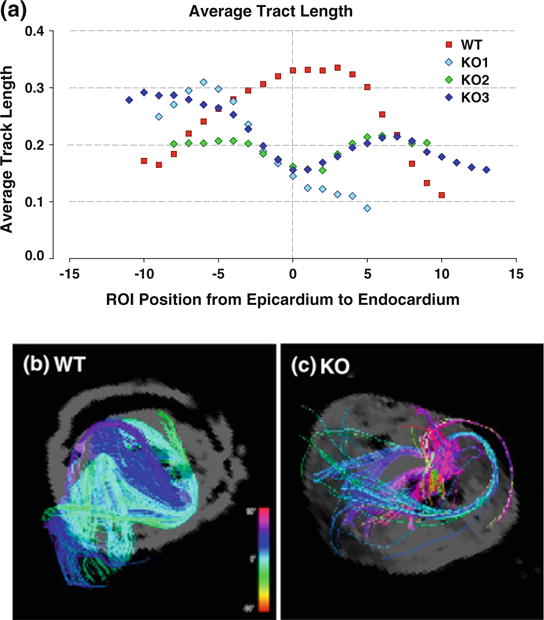
Average tract length and corresponding DSI projections in wild type (WT) compared with MyBP-C−/− (KO) hearts. (a) Plot of average fiber tract lengths along the left ventricular wall for three MyBP-C−/− (blue, purple, green) and two wild type (red) mouse hearts. For normalization, the average fiber lengths are divided by respective maximum fiber lengths measured for each specimen. At the midmyocardium (ROI position 0), the wild type (WT) fiber length are maximal while the peaks, while the KO myofiber lengths are minimal. Tract length variation as a function of transmural position was super-imposable for the wild type mouse hearts, whereas tract length variation for the mutant hearts displayed subtle differences. Using a ROI sphere, DSI images of the (b) WT and (c) KO are displayed at the midwall. The WT myocardium fibers appear dense, coherent and strongly aligned in the same circumferential helical pattern, whereas the KO myofiber tracts appear sparse, short, and disorganized with dissimilar helix angles.
FIG. 6.
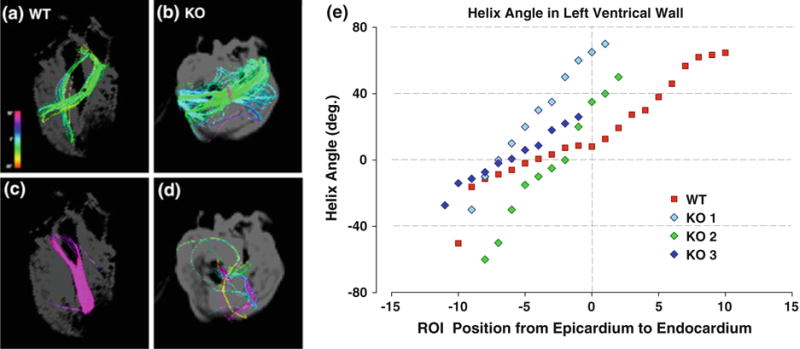
Comparison of myofiber helix angles in corresponding DSI projections in wild type (WT) compared with MyBP-C−/− (KO) hearts. Isolated subepicardial and subendocardial fibers of WT (red) and KO (blue, purple, green) hearts shown from the two chamber, left ventricle view. A ROI sphere was used to isolate fibers from DSI projections. (a and b) Display fibers on the subepicardial surface. (c and d) Display fibers on the subendocardial surface. While (a) and (b) both display coherent tracts, fibers on the subendocardium differ. The WT (c) fibers remain strongly coherent, while the KO (D) fibers are few and disorganized. Myofiber helix angles in the left ventricle of WT and KO hearts were imaged by DSI and plotted as a function of varying transmural locations in the case of individual WT and KO animals (e). The myofiber tracts in the WT myocardium varied from 260° helix angle in the subepicardium to 0° in the midmyocardium and 87° in the subendocardium. In the MyBP-C−/− myocardium, the transition from negative to positive helix angles occurs faster and more linearly than the wild type and is restricted to the subepicardium (negative ROI positions). From the midmyocardium to the subendocardium, the helix angles could not be measured because of a lack of coherence.
DISCUSSION
We questioned in this study whether a novel, multiscale NMR method for imaging complex myofiber orientation in tissue, diffusion spectrum imaging with tractography, was capable of distinguishing normal from disordered myoarchitecture in the setting of model congenital HCM. Variations in the expression of cardiac myofilament proteins, such as the ablation of MyBP-C, either alone or in association with compensatory expression or post-translational modification of associated proteins, are believed to be associated with congenital HCM. The current studies confirm that the normal myoarchitecture of the mouse heart consists of a series of helical myofiber structures with transmurally varying helix angles, whose net contraction promotes torsional rotation and ventricular lumen closure, whereas the hearts of MyBP-C knockout mice display marked myofiber disorganization and a loss of the normal transmural progression of helix angles.
DSI is an NMR imaging method designed to quantify the alignment of fibers based on the determination of the 3D spin displacement function.10,20,40 To achieve this goal, DSI obtains numerous diffusion-weighted MR images per voxel, each with a different diffusion-weighted gradient value and orientation. Deriving from a solution of the diffusion propagator formalism, DSI defines the probability that a nuclear spin will diffuse a certain distance over a specific interval of time. This results in a probability function for the complete set of possible molecular displacements per voxel as a function of diffusive motion. The probability function for a given diffusion data set is based on the Fourier relationship between this function and the spin echo diffusion signal obtained at various gradient strengths.4 In this manner, DSI overcomes the limitations of DTI imposed by its strict Gaussian dependence. While DTI depicts transmural variation of the helix angles on the basis of local (voxel-specific) differences in the orientation of the principal diffusion eigenvector, DSI provides direct visualization of myocardial fiber orientation viewable from any orientation. Tractographic visualization, moreover, substantiates the definition of layered myocardial sheets, which are loosely bound by collagen in order to allow reorientation in response to wall thickening during contraction. By its ability to depict the net diffusive environment within a given voxel as a set of oriented diffusion maxima, DSI has the capacity to resolve the complex architectural patterns present in normal and pathological myocardium.
MyBP-C is a thick filament accessory protein that reversibly binds phosphate and thereby regulates the interaction and binding of myosin and actin.8,13 While it was initially believed that MyBP-C was a structural protein involved in the assembly and stabilization of thick filaments in striated muscle,39 mice expressing reduced MyBP-C exhibit diminished ejection fraction, prolonged relaxation time, and an increased rate of ventricular stiffening during isovolumic contraction.13 These findings may be explained by a modulation of the rate of cross-bridge cycling, a change in the availability of myosin cross-bridges to actin, or a variation of Ca2+ sensitivity.3,5,14,23,31 These and subsequent results18,21 have led to the supposition that MyBP-C tethers the myosin head and thereby reduces the access of myosin heads to actin. Notwithstanding, significant questions remain regarding the mechanism by which expression of MyBP-C affects multicellular organization and organ scale mechanics.
Extending previous findings37 suggesting that HCM is associated with myocyte disorganization, we hypothesized that impaired expression of MyBP-C would similarly be associated with the presence of myoarchitectural disarray at the tissue scale. We demonstrate in the current study employing DSI tractography that the ablation of MyBP-C in the mouse is associated with the loss of the predicted variation of transmural helix angle configuration and a loss of intervoxel orientational coherence in the region spanning the mid-wall to the endocardium. The phenotypic selectivity of this fiber disorder to the inner half of the ventricular wall may be attributable to the fact that segments of the myocardial wall develop at different stages of embryogenesis and supports the genetic origin of the observed myoarchitectural disarray. Following the initial formation of the atrial and ventricular chambers, primitive cells undergo epithelial-to-mesenchymal transformation leading ultimately to the subendocardium,7,26 whereas the proepicardium develops through a distinct epithelial-to-mesenchymal transformation.41 Depth specific differences of myoarchitecture may impact on cardiac tissue mechanics in that MyBP-C−/− hearts possess a shortened contraction time,17,30 and moreover achieve greater maximum peak elastance at the onset of ejection compared to the wild type.22 The faster transition from negative to positive helix angles in the MyBP-C−/− hearts may enhance the extent of initial elastance by means of faster force activation, whereas the more rapid onset of elastance and lack of helical fiber development from the midwall to the subendocardium promote a shorter contraction time. The more rapid transition from left-to right-handed helices in the subendocardium of the MyBP-C−/− hearts may be associated with a more increased force at the onset of contraction. Since the angle of rotation in the subendocardium is greater than that in the subepicardium, subendocardial fibers should achieve larger angles of rotation and therefore generate higher pressures.43 The lack of fiber coherence principally in the subendocardium of the knockout mouse should therefore lead to net shorter periods of maximum force and reduced systolic force generation.
We conclude that the DSI tractography is capable of resolving myoarchitectural disarray in a mouse model of hypertrophic cardiomyopathy. We specifically demonstrate that the ablation of MyBP-C is associated with the loss of voxel-to-voxel orientational coherence for those fibers principally located in the mid-myocardium-subendocardium, resulting in a characteristic change in the transmural progression of helix angles throughout the myocardial wall. We speculate that the loss of normal fiber helicity in MyBP-C−/− hearts leads to abnormal force development by impairments in torsional mechanics. This conceptualization of heart failure therefore substantiates a multi-scale model in which molecular changes in myocyte structure and function are associated with the variations of the 3D alignment of myocytes within the ventricular wall and organ scale force generation.
Footnotes
Associate Editor Scott I. Simon oversaw the review of this article.
References
- 1.Basser PJ. Fiber-tractography via diffusion tensor MRI (DT-MRI); Proceedings of the 6th Annual Meeting of the International Society of Magnetic Resonance Medicine; Sydney, Australia. 1998. [Google Scholar]
- 2.Bloch F. Nuclear induction. Phys Rev. 1946;70:460–474. [Google Scholar]
- 3.Calaghan SC, Trinick J, Knight PJ, White E. A role for C-protein in the regulation of contraction and intracellular Ca2+ in intact rat ventricular myocytes. J Physiol (Lond) 2000;528(1):151–156. doi: 10.1111/j.1469-7793.2000.00151.x. [DOI] [PMC free article] [PubMed] [Google Scholar]
- 4.Callaghan PT. NMR imaging, NMR diffraction and applications of pulsed gradient spin echoes in porous media. Magn Reson Imaging. 1996;14(7–8):701–709. doi: 10.1016/s0730-725x(96)00152-x. [DOI] [PubMed] [Google Scholar]
- 5.Colson BA, Bekyarova R, Fitzsimons DP, Irving TC, Moss RL. Radial displacement of myosin cross-bridges in mouse myocardium due to ablation of myosin binding protein-C. J Mol Biol. 2007;367:36–41. doi: 10.1016/j.jmb.2006.12.063. [DOI] [PMC free article] [PubMed] [Google Scholar]
- 6.Dou J, Tseng WY, Reese TG, Wedeen VJ. Combined diffusion and strain MRI reveals structure and function of human myocardial laminar sheets in vivo. Mag Res Med. 2003;50:107–113. doi: 10.1002/mrm.10482. [DOI] [PubMed] [Google Scholar]
- 7.Eisenberg LM, Markwald RR. Cellular recruitment and the development of the myocardium. Dev Biol. 2004;274:225–232. doi: 10.1016/j.ydbio.2004.07.023. [DOI] [PubMed] [Google Scholar]
- 8.Flashman E, Redwood C, Moolman-Smook J, Watkins H. Cardiac myosin binding protein C. Circ Res. 2004;94:1279–1289. doi: 10.1161/01.RES.0000127175.21818.C2. [DOI] [PubMed] [Google Scholar]
- 9.Gaige TA, Kwon HS, Dai G, Cabral VC, Wang R, Nam YS, Engelward BP, Wedeen VJ, So PT, Gilbert RJ. Multiscale structural analysis of mouse lingual myoarchitecture employing diffusion spectrum magnetic resonance imaging and multiphoton microscopy. J Biomed Opt. 2008;13(6):064005. doi: 10.1117/1.3046724. [DOI] [PubMed] [Google Scholar]
- 10.Gilbert RJ, Magnusson LH, Napadow VJ, Benner T, Wang R, Wedeen VJ. Mapping complex myoarchitecture in the bovine tongue with diffusion-spectrum magnetic resonance imaging. Biophys J. 2006;91:1014–1022. doi: 10.1529/biophysj.105.068015. [DOI] [PMC free article] [PubMed] [Google Scholar]
- 11.Gilbert RJ, Wedeen VJ, Magnusson LH, Benner T, Wang R, Dai G, Napadow VJ, Roche KK. Three-dimensional myoarchitecture of the bovine tongue demonstrated by diffusion spectrum magnetic resonance imaging with tractography. Anat Rec A Discov Mol Cell Evol Biol. 2006;288:1173–1182. doi: 10.1002/ar.a.20387. [DOI] [PubMed] [Google Scholar]
- 12.Greenbaum RA, Ho SY, Gibson DG, Becker AE, Anderson RH. Left ventricular fiber architecture in man. Brit Heart J. 1981;45:248–263. doi: 10.1136/hrt.45.3.248. [DOI] [PMC free article] [PubMed] [Google Scholar]
- 13.Harris SP, Bartley CR, Hacker TA, McDonald KS, Douglas PS, Greaser ML, Powers PA, Moss RL. Hypertrophic cardiomyopathy in cardiac myosin binding protein-C knockout mice. Circ Res. 2002;90:594–601. doi: 10.1161/01.res.0000012222.70819.64. [DOI] [PubMed] [Google Scholar]
- 14.Harris SP, Rostkova E, Gautel M, Moss RL. Binding of myosin binding protein-C to myosin subfragment S2 affects contractility independent of a tether mechanism. Circ Res. 2004;95(9):930–936. doi: 10.1161/01.RES.0000147312.02673.56. [DOI] [PubMed] [Google Scholar]
- 15.Hunter PJ, Pullan AJ, Smaill BH. Modeling total heart function. Annu Rev Biomed Eng. 2003;5:124–177. doi: 10.1146/annurev.bioeng.5.040202.121537. [DOI] [PubMed] [Google Scholar]
- 16.Kim KH, Buehler C, So PT. High-speed, two-photon scanning microscope. Appl Opt. 1999;38:6004–6009. doi: 10.1364/ao.38.006004. [DOI] [PubMed] [Google Scholar]
- 17.Korte RS, McDonald KS, Harris SP, Moss RL. Load shortening, power output, and rate of force redevelopment are increased with knockout of cardiac myosin binding protein-C. Circ Res. 2003;93:752–758. doi: 10.1161/01.RES.0000096363.85588.9A. [DOI] [PubMed] [Google Scholar]
- 18.Lecarpentier Y, Vignier N, Oliviero P, Guellich A, Carrier L, Coirault C. Cardiac myosin-binding protein C modulates the tuning of the molecular motor in the heart. Biophys J. 2008;95(2):720–728. doi: 10.1529/biophysj.107.127787. [DOI] [PMC free article] [PubMed] [Google Scholar]
- 19.LeGrice IJ, Takayama Y, Covell JW. Transverse shear along myocardial cleavage planes provides a mechanism for normal systolic wall thickening. Circ Res. 1995;77:182–193. doi: 10.1161/01.res.77.1.182. [DOI] [PubMed] [Google Scholar]
- 20.Lin CP, Wedeen VJ, Chen JH, Yao C, Tseng WY. Validation of diffusion spectrum magnetic resonance imaging with manganese-enhanced rat optic tracts and ex vivo phantoms. Neuroimage. 2003;19:482–495. doi: 10.1016/s1053-8119(03)00154-x. [DOI] [PubMed] [Google Scholar]
- 21.Luther PK, Bennett PM, Knupp C, Craig R, Padron R, Harris SP, Patel J, Moss RL. Understanding the organization and role of myosin binding protein C in striated muscle by analysis of normal and MyBP-C knockout muscle. J Mol Biol. 2008;384(1):60–72. doi: 10.1016/j.jmb.2008.09.013. [DOI] [PMC free article] [PubMed] [Google Scholar]
- 22.Palmer BM, Georgakopoulos D, Janssen PM, Wang Y, Alpert NR, Belardi DF, Harris SP, Moss RL, Burgon PG, Seidman CE, Seidman JG, Maughan DW, Kass DA. Role of cardiac myosin binding protein C in sustaining left ventricular systolic stiffening. Circ Res. 2004;94:1249–1255. doi: 10.1161/01.RES.0000126898.95550.31. [DOI] [PubMed] [Google Scholar]
- 23.Pohlmann L, Kroger I, Vignier N, Schlossarek S, Kramer E, Coirault C, Sultan KR, El-Armouche A, Winegrad S, Eschenhagen T, Carrier L. Cardiac myosin binding protein C is required for complete relaxation in intact myocytes. Circ Res. 2007;101:928–938. doi: 10.1161/CIRCRESAHA.107.158774. [DOI] [PubMed] [Google Scholar]
- 24.Ragan T, Sylvan JD, Kim KH, Huang H, Bahlmann K, Lee RT, So PT. High-resolution whole organ imaging using two-photon tissue cytometry. J Biomed Opt. 2007;12:14015. doi: 10.1117/1.2435626. [DOI] [PubMed] [Google Scholar]
- 25.Sabbah HN, Marzilli M, Stein PD. The relative role of subendocardium and subepicardium in left ventricular mechanics. Am J Physiol. 1981;240(6):H920–H926. doi: 10.1152/ajpheart.1981.240.6.H920. [DOI] [PubMed] [Google Scholar]
- 26.Smith TK, Bader DM. Signals from both sides: control of cardiac development by the endocardium and epicardium. Cell Dev Biol. 2007;18:84–89. doi: 10.1016/j.semcdb.2006.12.013. [DOI] [PMC free article] [PubMed] [Google Scholar]
- 27.Sosnovik DE, Wang R, Dai G, Wang T, Aikawa E, Novikov M, Rosenzweig A, Gilbert RJ, Wedeen VJ. Diffusion spectrum MRI tractography reveals the presence of a complex network of residual myofibers in infarcted myocardium. Circ Cardiovasc Imaging. 2009;2(3):206–212. doi: 10.1161/CIRCIMAGING.108.815050. [DOI] [PMC free article] [PubMed] [Google Scholar]
- 28.Stejskal EO, Tanner JE. Spin diffusion measurements—spin echoes in presence of a time-dependent field gradient. J Chem Phys. 1965;42:288–292. [Google Scholar]
- 29.Stejskal EO, Tanner JE. Use of spin echoes in a pulsed magnetic field gradient to study anisotropic restricted diffusion and flow. J Chem Phys. 1965;43:3597–3603. [Google Scholar]
- 30.Stelzer JE, Dunning SB, Moss RL. Ablation of cardiac myosin-binding protein-C accelerates stretch activation in murine skinned myocardium. Circ Res. 2006;98:1212–1218. doi: 10.1161/01.RES.0000219863.94390.ce. [DOI] [PubMed] [Google Scholar]
- 31.Stelzer JE, Fitzsimons DP, Moss RL. Ablation of myosin-binding protein-C accelerates force development in mouse myocardium. Biophys J. 2006;90(11):4119–4127. doi: 10.1529/biophysj.105.078147. [DOI] [PMC free article] [PubMed] [Google Scholar]
- 32.Streeter DD, Hannan WT. Engineering mechanics for successive states in canine left ventricular myocardium: I. Cavity and wall geometry. Circ Res. 1973;33:639–655. doi: 10.1161/01.res.33.6.639. [DOI] [PubMed] [Google Scholar]
- 33.Streeter DD, Spotnitz HM, Patel DP, Ross J. Fiber orientation in the canine left ventricle during diastole and systole. Circ Res. 1969;24:339–347. doi: 10.1161/01.res.24.3.339. [DOI] [PubMed] [Google Scholar]
- 34.Strijkers GJ, Bouts A, Blankesteijn WM, Peeters TH, Vilanova A, van Prooijen MC, Sanders HM, Heijman E, Nicolay K. Diffusion tensor imaging of left ventricular remodeling in response to myocardial infarction in the mouse. NMR Biomed. 2009;22(2):182–190. doi: 10.1002/nbm.1299. [DOI] [PubMed] [Google Scholar]
- 35.Torrent-Guasp F, Kocica MJ, Corno AF, Komeda M, Carreras-Costa F, Flotats A, Cosin-Aguillar J, Wen H. Towards new understanding of the heart structure and function. Err J Cardiothoracic Surg. 2005;27:191–201. doi: 10.1016/j.ejcts.2004.11.026. [DOI] [PubMed] [Google Scholar]
- 36.Torrey HC. Bloch equations with diffusion terms. Phys Rev. 1956;104:563–565. [Google Scholar]
- 37.Tseng WY, Dou J, Reese TG, Wedeen VJ. Imaging myocardial fiber disarray and intramural strain hypokinesis in hypertrophic cardiomyopathy with MRI. JMRI. 2006;23(1):1–8. doi: 10.1002/jmri.20473. [DOI] [PubMed] [Google Scholar]
- 38.Tseng WY, Reese TG, Weisskoff RM, Brady TJ, Wedeen VJ. Myocardial fiber shortening in humans: initial results of MR imaging. Radiology. 2000;216:128–139. doi: 10.1148/radiology.216.1.r00jn39128. [DOI] [PubMed] [Google Scholar]
- 39.Vikstrom KL, Seiler SH, Sohn RL, Strauss M, Weiss A, Welikson RE, Leinwand LA. The vertebrate myosin heavy chain: genetics and assembly properties. Cell Struct Funct. 1997;22(1):123–129. doi: 10.1247/csf.22.123. [DOI] [PubMed] [Google Scholar]
- 40.Wedeen VJ, Reese TG, Tuch DS, Wiegell MR, Dou JG, Weisskoff RM, Chessler D. Mapping fiber orientation spectra in cerebral white matter with Fourier-transform diffusion; Proceedings of the 8th Annual Meeting of the International Society for Magnetic Resonance in Medicine; Denver, Colorado, USA. 2000. [Google Scholar]
- 41.Wessels A, Perez-Pomares JM. The epicardium and epicardially derived cells (EPDCs) as cardiac stem cells. Anat Rec A. 2004;276A:43–57. doi: 10.1002/ar.a.10129. [DOI] [PubMed] [Google Scholar]
- 42.Winegrad S. Cardiac myosin binding protein C. Circ Res. 1999;84:1117–1126. doi: 10.1161/01.res.84.10.1117. [DOI] [PubMed] [Google Scholar]
- 43.Yin FC. Ventricular wall stress. Circ Res. 1981;49:829–842. doi: 10.1161/01.res.49.4.829. [DOI] [PubMed] [Google Scholar]


