
FIGURE 6.
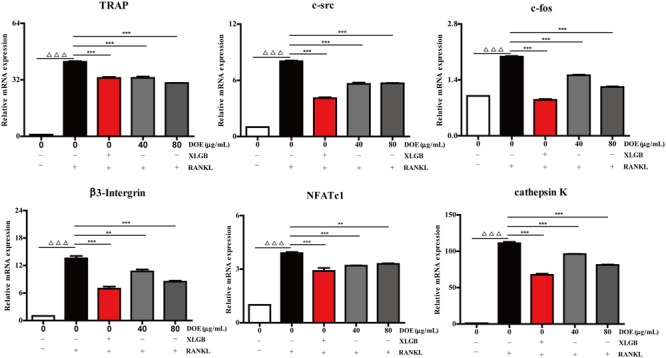
DOE treatment reduces the expression of osteoclast-specific marker genes. Values are means ± SEM of three independent experiments. ∆ ∆ ∆P < 0.001 versus the control, and ∗∗P < 0.01, and ∗∗∗P < 0.001 versus just RANKL-treated cells.
Official websites use .gov
A
.gov website belongs to an official
government organization in the United States.
Secure .gov websites use HTTPS
A lock (
) or https:// means you've safely
connected to the .gov website. Share sensitive
information only on official, secure websites.
DOE treatment reduces the expression of osteoclast-specific marker genes. Values are means ± SEM of three independent experiments. ∆ ∆ ∆P < 0.001 versus the control, and ∗∗P < 0.01, and ∗∗∗P < 0.001 versus just RANKL-treated cells.