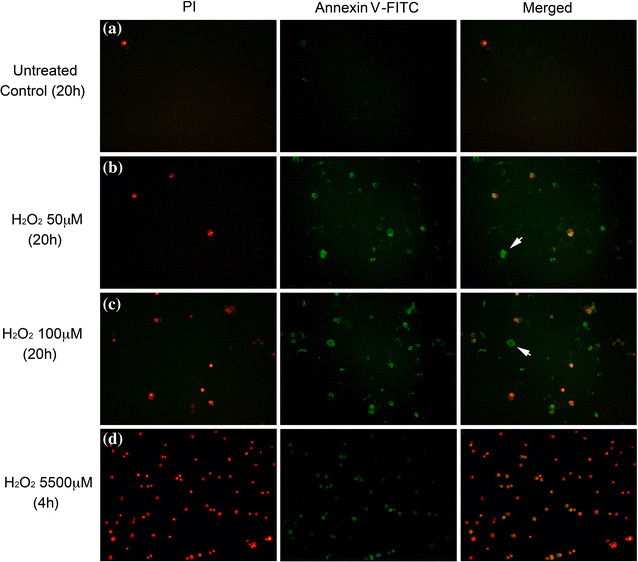
Fig. 2.

Fluorescence images of BV-2 cells stained with PI and FITC-annexin V. BV-2 cells challenged with H2O2 at: Row a: medium control—20 h, Row b: 50 μM—20 h, Row c: 100 μM—20 h, and Row d: 5500 μM—4 h. After H2O2 treatments, cells were collected, washed and stained with both PI and FITC-annexin V fluorophores. PI and FITC signals were captured separately by a fluorescence microscope and the images were merged to identify the localization of the stains. PI and FITC signal was represented as red and green color, respectively. White arrows highlight cells undergoing apoptosis
