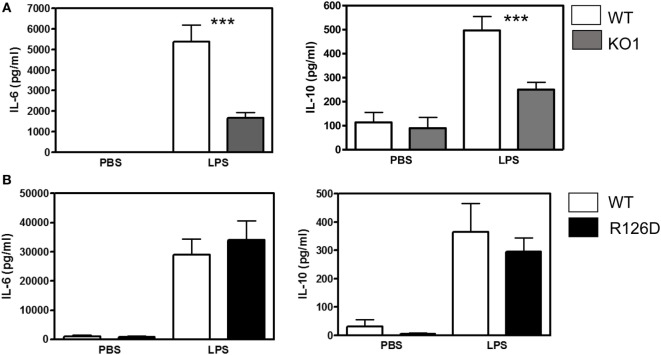
Figure 3.
Analysis of lipopolysaccharide (LPS)-dependent cytokine responses in siglec-E-deficient mice. (A) Wild-type (WT) and KO1 mice and (B) WT and R126D mice were injected with 15 µg ultrapure LPS or PBS intraperitoneally and blood collected at 3 h. IL-6 and IL-10 concentrations in sera were measured by ELISA. Data show means + 1 SD from pooled samples, derived from two independent experiments, with three to six mice in each experiment. Statistical analysis was performed using Mann–Whitney t-test, ***indicates significant differences between WT and KO1 mice, p < 0.0005.

