Fig. 5.
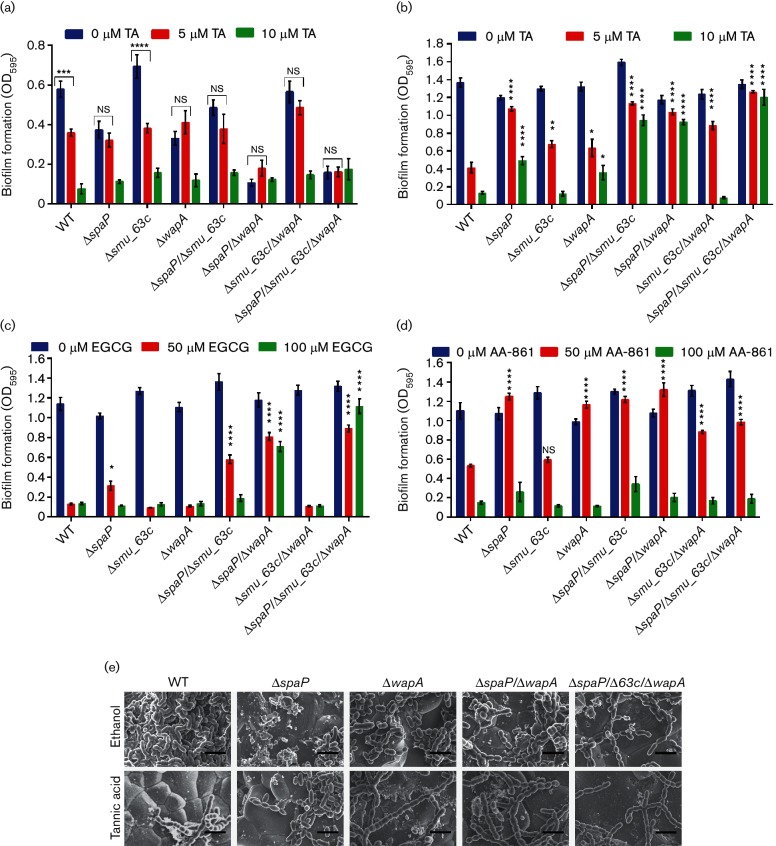
Inhibition of biofilm formation by TA, EGCG or AA-861. (a) CV assays of S. mutans WT and deletion-mutant biofilms grown in BM-glucose and in the presence of the indicated concentrations of TA. b–d: CV assays of the same biofilms grown in BM-sucrose in the presence of indicated concentrations of TA (b); EGCG (c); and AA-861 (d). Error bars represent the mean±sem of six independent replicates. Statistical significance was evaluated by two-way ANOVA using Tukey’s multiple comparisons. Asterisks indicate the statistical significance of the comparison of the mean±sem value of each deletion mutant to that of the WT under the same inhibitor concentration: *P<0.05; **P<0.01; ***P<0.001; ****P<0.0001. (e) FE-SEM of S. mutans WT and mutant biofilms grown in BM-glucose and sucrose with 10 µM TA (bottom panel) or the 0.1 % ethanol diluent control (top panel). Scale bars represent 2 µm.

