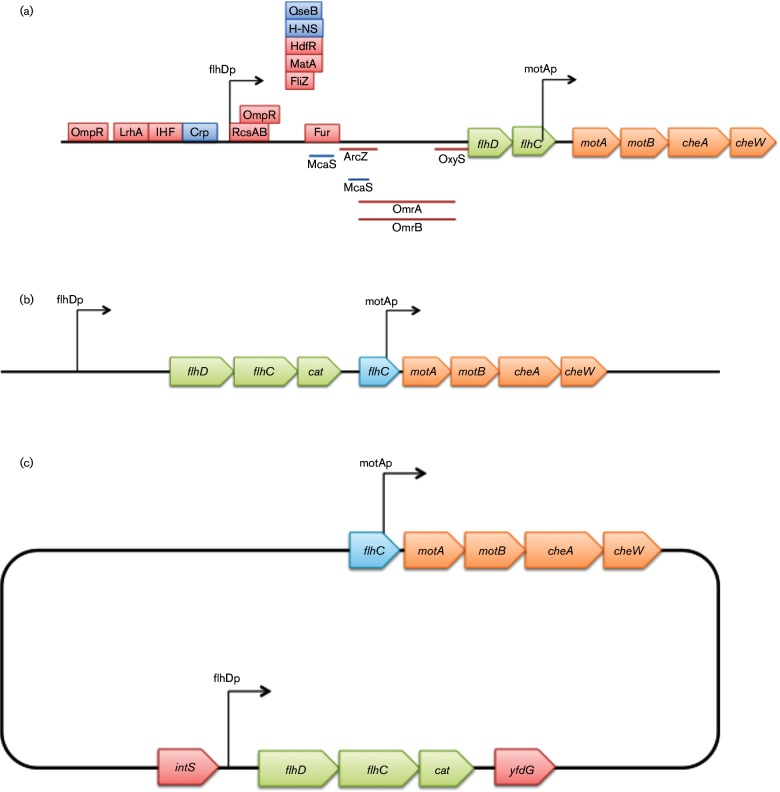
Fig. 1.
Schematic diagram of the flhDC and motAB/cheAW operons and constructs used in the present study. (a) Schematic diagram of the wild-type flhDC and motAB/cheAW operons. The flhD and flhC genes are transcribed from one promoter while the motA, motB, cheA and cheW genes are transcribed from a second promoter located in the 3′ region of flhC. Red rectangles indicate binding sites for some negative regulators, and blue rectangles indicate the same for certain positive regulatory proteins. The lines below the gene depictions denote binding sites for small RNAs. The two arrows indicate the promoters. (b) Schematic diagram of the constructs used to understand the regulated expression of the flhDC operon in the CAT strain. The cat gene is fused immediately after the flhC gene, yielding the flhDC : cat operon that is under the control of the native flhDC promoter. The 3′ region of the flhC gene bearing the motA promoter was fused to the motA gene. This promoter is therefore between the cat and motA genes so that the downstream genes are expressed under the control of the native promoter. (c) Schematic diagram of the CAT2 strain. The region containing the flhDC promoter and the flhDC:cat operon were moved into the intS/yfdG intergenic region (bottom). The original flhDC promoter, flhD and the 5′ part of flhC were deleted (top).

