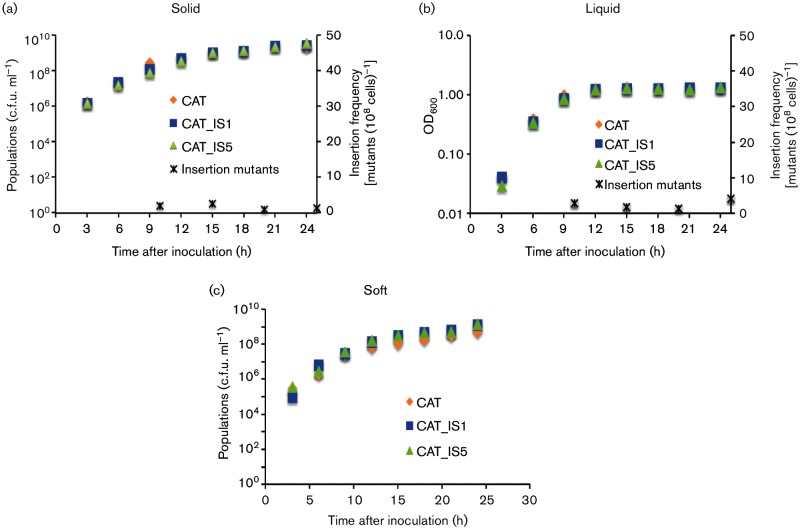
Fig. 3.
Growth and mutant appearance frequencies on solid agar plates (a), in liquid medium (b) and in soft (0.3 %) agar (c). (a) CAT (orange rhombuses), CAT_IS1 (blue squares),and CAT_IS5 (green triangles) were inoculated separately on solid agar plates (0.5 % tryptone, 0.5 % NaCl and 1.5 % agar) and incubated at 30 °C for 25 h. Cells were washed off the plates, diluted, plated and grown for colony counting. The growth curves were plotted for each strain as a function of time. These three curves use the left y-axis. Insertion mutant populations were determined by plating onto LB+Cm plates. The insertion mutant ratios were determined at four time points throughout the 25 h period. The ratio is recorded on the right y-axis. Error, expressed in sd values, was less than 5 % of the measured values in (a), (b) and (c). (b) CAT, CAT_IS1 and CAT_IS5 strains were inoculated separately into liquid media (0.5 % tryptone, 0.5 % NaCl and 0 % agar) at 30 °C for 24 h, and cultures were rotated at 250 r.p.m. The growth curves were plotted for each strain. Insertion frequencies in liquid media from the CAT strain were measured, and the insertion mutant ratios were measured at four time points through the 25 h period. Format of presentation is as for (a). (c) CAT, CAT_IS1 and CAT_IS5 strains were inoculated into soft agar plates (0.5 % tryptone, 0.5 % NaCl and 0.3 % agar) separately and incubated at 30 °C for 24 h. The populations were measured every 3 h. Format of presentation is as for (a). Insertion frequencies are presented in Fig. 4.

