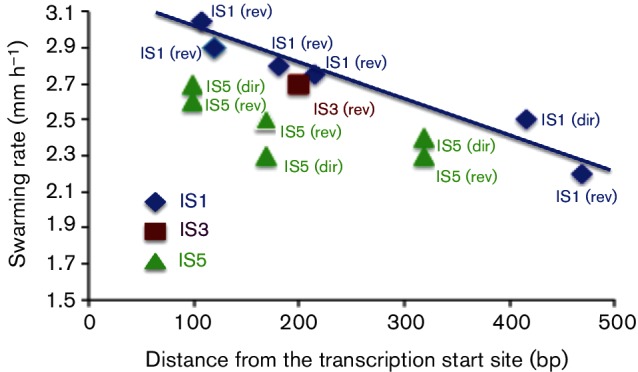
Fig. 9.

Insertion sites versus swarming rates. Colony expansion swarming rates in soft agar for the different insertion mutants were plotted as a function of distance from the flhD transcriptional start site. The data are from Table 1 (no glucose). The IS element type and its insertional orientation are indicated [direct (dir) or reverse (rev)]. Distance from the transcriptional start site is indicated on the x-axis. Errors of triplicate determinations were usually within 5 % of the measured values.
