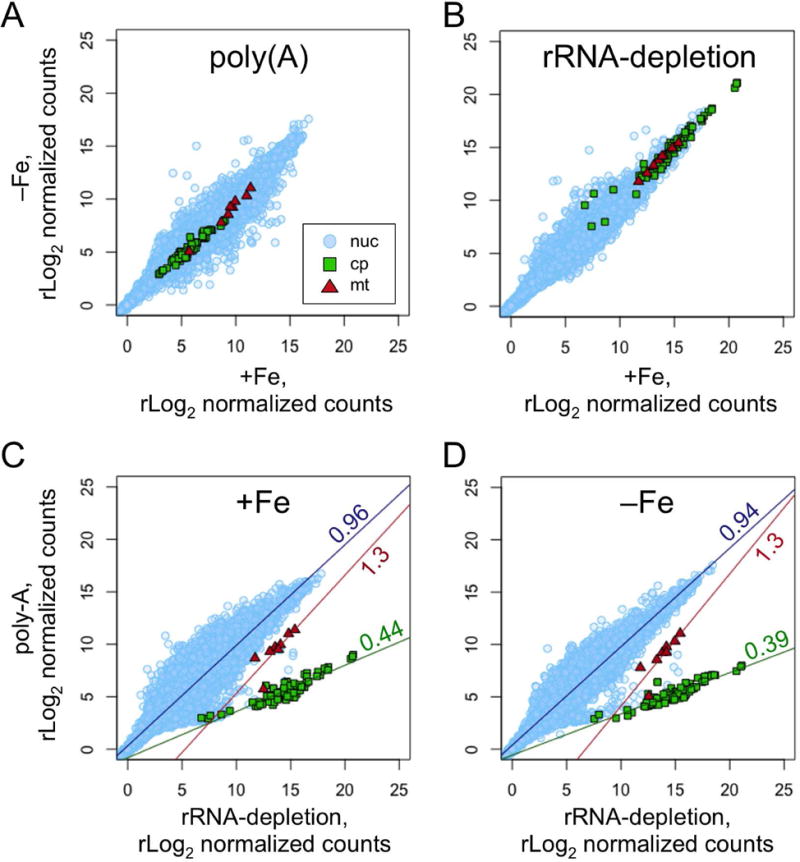
Figure 10. Comparison of RNA-Seq library preparation methods.

Total RNA was collected from cultures grown in media with 20 μM Fe (+Fe) or 4 h after transfer to media with <0.01 μM Fe (−Fe). The purified RNA was then used to construct RNA-Seq libraries using either a poly(A)-enrichment protocol or an rRNA-depletion protocol. Sequencing reads from each library were aligned to the nuclear, chloroplast and mitochondrial genomes in parallel. The number of counts per gene were determined and rLog2 normalized by DESeq2. The resulting counts per gene were plotted as pair-wise scatter plots with nuclear genes as light blue circles, chloroplast genes as green squares, and mitochondrial genes as red triangles. Comparisons of the −Fe sample versus the +Fe sample for libraries prepared by (A) the poly(A) protocol, or by (B) the rRNA-depletion protocol are shown. Comparisons of the poly(A) protocol versus the rRNA-depletion protocol for (C) the +Fe sample, or for (D) the −Fe sample are shown. For (C) and (D), a linear regression was fit to each set of genes and plotted. The slope of the line is indicated.
