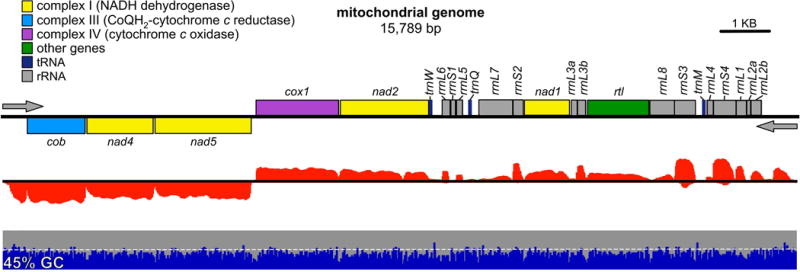
Figure 2. Map of the C. reinhardtii mitochondrial genome, MTv4.

A map of the C. reinhardtii mitochondrial genome, MTv4, is presented as a series of tracks. Gene models are presented as colored boxes above and below the line to indicate strandedness. Categories of genes are color-coded according to the accompanying legend. The direction of transcription is indicated by gray arrows. Below that in red, an RNA-Seq coverage track from a representative experiment. Strandedness is indicated as above. Next, in blue and gray, a plot of the GC content in non-overlapping 25 bp windows, with blue for %GC and gray for %AT. The 50% mark is indicated by a dashed white line, and the overall average GC content is indicated at the far left. A scale bar in the upper right indicates 1 kbp.
