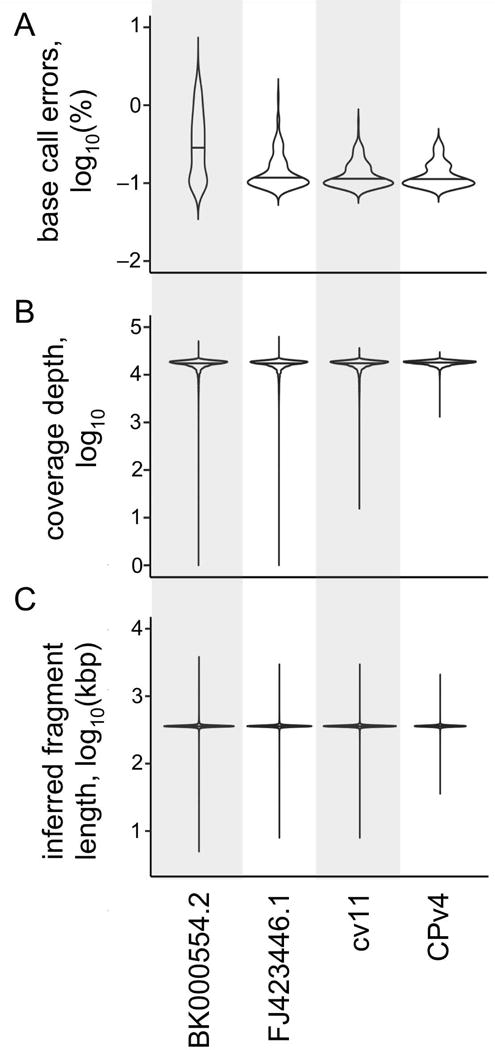
Figure 4. Evaluating genome versions.

As in Figure 3, four different versions of the C. reinhardtii chloroplast genome were compared using a variety of metrics. A set of 1×10⁸ paired-end DNA-Seq reads (100 +100 nt) were aligned to each genome version in parallel using the same parameters. (A) The error rate was determined as percentage of mismatched base calls relative to total base calls for each locus in each genome version. This error rate was averaged across all loci in non-overlapping 1 kbp windows, log10-transformed, and then plotted as a violin plot. A base call was considered errant if it differed from the reference, or if it represented an insertion or deletion. (B) The depth of coverage at each locus was determined, and log10-transformed. The distribution of coverage is presented as a violin plot for each genome version. (C) The inferred size of the DNA fragments in the DNA-Seq library were determined by the relative position of their alignments in each genome version. The average of the inferred fragment sizes was calculated for each locus, log10-transformed, and then plotted as a violin plot. In each panel, the median of the distribution is indicated by a horizontal line.
