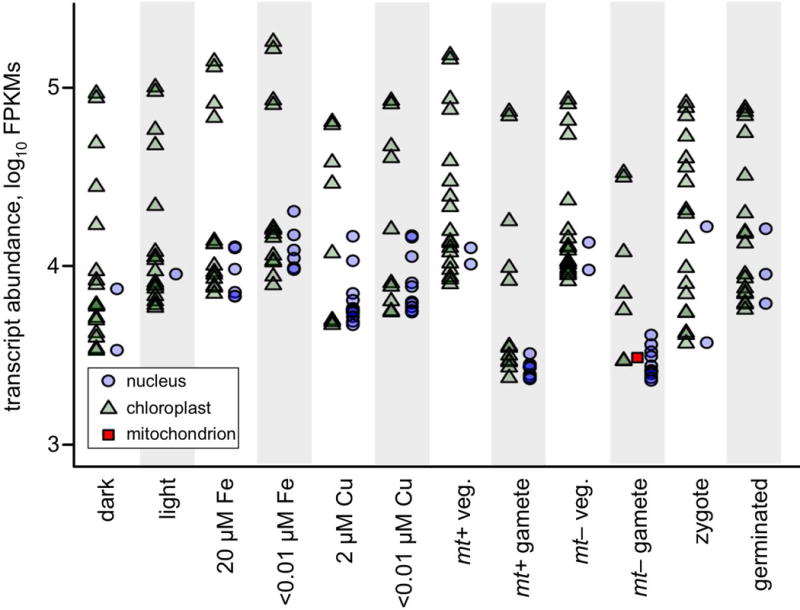
Figure 9. Twenty most abundant cellular transcripts.

Transcript abundances were quantified in terms of FPKMs by RNA-Seq from 12 different cultures of C. reinhardtii grown under various conditions as indicated in the figure (see text for details). The 20 most abundant transcripts in each sample were plotted on a log10 scale with following symbols: nucleus-encoded transcripts as blue circles, chloroplast-encoded transcripts as green triangles, and mitochondrion-encoded transcripts as red squares. Additional information on these genes, including gene names and FPKMs, can be found in Supplemental Data S8.
