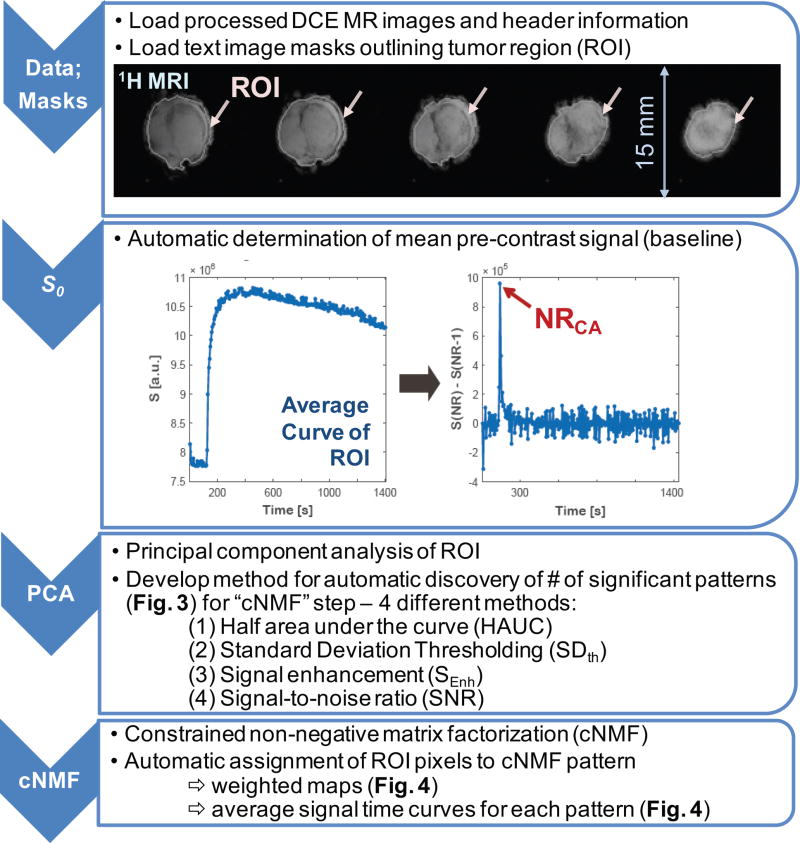
Figure 2. Processing steps for DCE-MRI data analysis. (Data; Masks).
Processed DCE-MRI images and manually contoured tumor region of interest (ROI) are up-loaded to the program. A representative example (HEK #1) showing the 1H MR images of the 5 tumor slices overlaid (white line) with the manually outlined tumor region (ROI) in each slice (arrows); (S0) Automatic determination of the time point of contrast agent arrival at tumor from an average signal-versus-time curve over tumor slice ROI; (PCA) Automatic determination of the number of patterns (NPs) using Principal Component Analysis (PCA); (cNMF) Automatic assignment of ROI pixels to constrained Non-negative Matrix Factorization (cNMF) pattern or pattern mixture. Note that three out of the four steps underwent automation.

