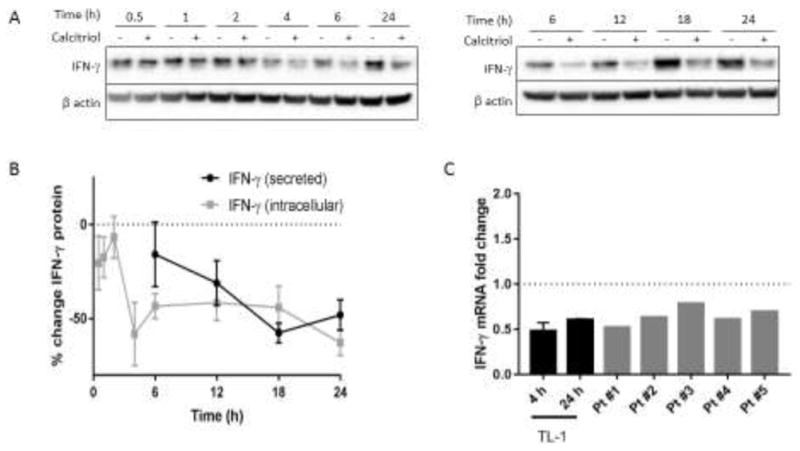
Figure 1. IFN-γ is reduced on the mRNA and protein levels following calcitriol treatment.

A. Western blot analysis was performed on TL-1 lysates harvested at time points following calcitriol or vehicle treatment. Representative western blots are shown, with β actin used as a loading control. B. IFN-γ band intensity from part A was normalized to β actin and then expressed relative to the ethanol control to illustrate changes in protein levels as a result of calcitriol treatment (n=3–7, +/− SEM). Supernatant was collected from cells treated as in A and sent for Luminex analysis of secreted IFN-γ (n=3, +/− SEM). C. TL-1 cells were treated with calcitriol for 4 or 24 h and IFN-γ transcript levels were assayed by qPCR. Primary T-LGLL patient PBMCs were treated with calcitriol for 24 h. Results were normalized to housekeeping gene UBC and then to the ethanol control (for TL-1, n=3, +/− SEM).
