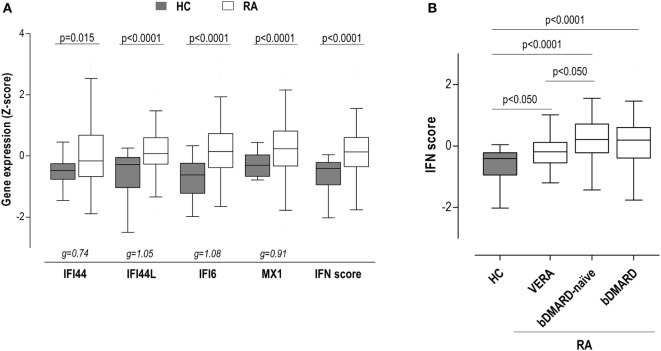
Figure 1.
Interferon (IFN)-responding gene (IRG) expression and IFN score in rheumatoid arthritis (RA) patients. (A) The expression of the individual IRGs [IFN-induced protein 44 (IFI44), IFN-induced protein 44 like (IFI44L), IFN alpha inducible protein 6 (IFI6), and MX dynamin-like GTPase 1 (MX1)] and the levels of the IFN score were compared between healthy control (HC) (gray boxes) and RA patients (white boxes). (B) The levels of the IFN score were compared between HC and RA patients according to the different clinical stages. Boxes represent 25th and 75th percentiles, whereas whiskers represent minimum and maximum values. Statistical analyses were performed by Kruskal–Wallis with Dunn–Bonferroni tests for multiple comparisons. P values correspond to those obtained in the multiple comparisons tests. For the analysis of individual IRGs, Hedges’g statistics (at the bottom of the graph) was included to account for the differential size effects observed across IRGs.

