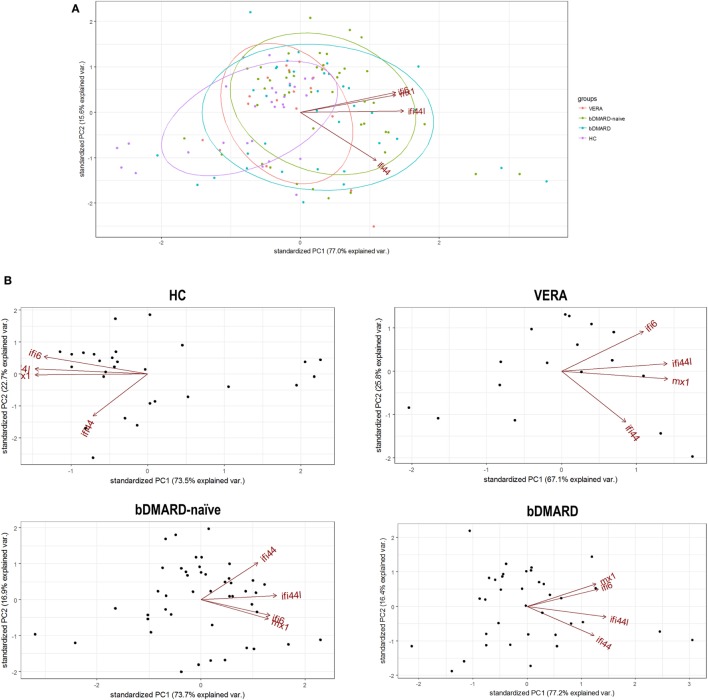
Figure 2.
Analysis of the associations among interferon (IFN)-responding genes (IRGs) by PCA. (A) Biplot from the PCA (correlation method) conducted on all the groups analyzed [healthy control (HC), purple; VERA, red; biological disease-modifying antirheumatic drug (bDMARD)-naive, green; and bDMARD, blue]. Arrows represent the original variables. The angles between the arrows represent their correlation. Ellipses are drawn for each group (probability set as 0.68, by default). KMO = 0.705, Bartlett sphericity test P = 4 × 10⁻⁸, determinant = 0.032. (B) PCA conducted individually for each group of individuals included in the study: HC [KMO = 0.695, Bartlett sphericity test P = 1.5 × 10⁻²⁵, determinant = 0.012], VERA [KMO = 0.734, Bartlett sphericity P = 2 × 10⁻⁷, determinant = 0.051], bDMARD-naive [KMO = 0.700, Bartlett sphericity test P = 1 × 10⁻²³, determinant = 0.053], and bDMARD [KMO = 0.642, Bartlett sphericity test P = 2 × 10⁻²⁵, determinant = 0.020].

