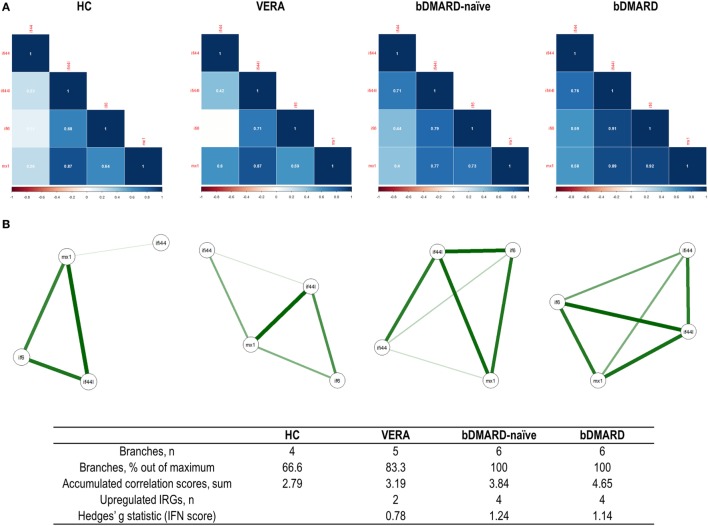
Figure 3.
Analysis of the correlations and structure of the interferon (IFN)-responding genes (IRGs) networks. (A) Analyses of the correlations among IRG in the different groups studied. Correlation matrices were plotted in 2 × 2 correlograms. Correlation coefficients were depicted in white. Color of the tiles is proportional to the strength of the correlation (color scale is represented at the bottom of each grap). (B) Network analyses of the IRGs in the groups studied. Each node corresponds to an IRG, and the lines illustrate the strength (width) and sign (green, positive; red, negative) of the correlations between each pair of variables. The interferon (IFN) network in healthy control (HC) is characterized by a group of three IRGs closely correlated [IFN-induced protein 44 like (IFI44L), MX dynamin-like GTPase 1, and IFN alpha inducible protein 6 (IFI6)], almost not related to IFI44L. Stronger correlations were observed in very early rheumatoid arthritis (VERA) and rheumatoid arthritis (RA) established groups compared to HC, and a more complex, intricate network was observed in biological disease-modifying antirheumatic drug (bDMARD) patients, with a closer location of all IRGs and a strong correlation between IFN-induced protein 44 (IFI44) and IFI44L. Similarly, a correlation between IFI6 and IFI44 is differentially expressed in established RA, compared to VERA or HC. Additional information on the network structure and its overall activation was summarized in the table at the bottom of the figure.

