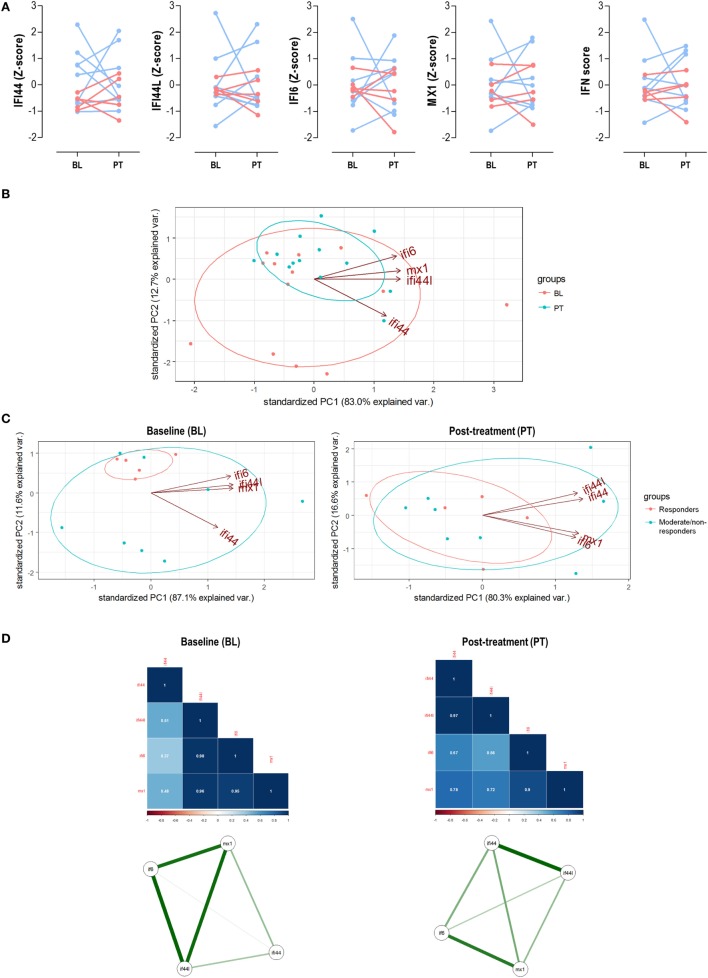
Figure 5.
Analysis of the interferon (IFN) signature upon tumor necrosis factor alpha (TNFα) blockade. (A) Paired analyses of the expression of the individual IFN-responding genes (IRGs) and IFN score at baseline (BL) and posttreatment (PT) with anti-tumor necrosis factor alpha (TNFα) in 13 patients prospectively followed up. Patients were represented in red (responders) and blue (moderate/non-responders). Statistical analyses were performed by Wilcoxon test. (B) Biplot from the PCA (correlation method) conducted on the—BL, red; PT, blue—samples from rheumatoid arthritis patients. Ellipses are drawn for each group (probability set as 0.68, by default). (C) PCA independently conducted for BL and PT samples to evaluate changes in the IRG occurring upon TNFα blockade. (D) Correlation matrices and network analyses of the IRGs in the BL and PT samples. Stronger associations among IFN-induced protein 44 like (IFI44L), IFN alpha inducible protein 6 (IFI6), and MX dynamin-like GTPase 1 (MX1) were found in the BL samples, with a farther location for IFN-induced protein 44 (IFI44). However, a more uniform pattern among IRGs was found after TNFα blockade (PT), pointing toward two IRG clusters (IFI44 + IFI44L and IFI6 + MX1). These results confirmed those obtained in the PCA and are in line with the findings from the cross-sectional analysis (Figure 2).

