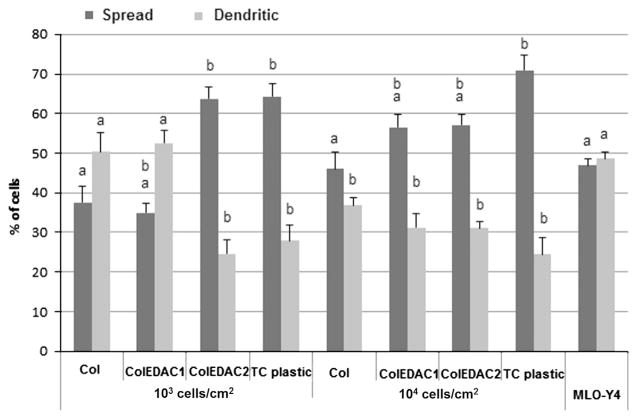
Fig. 3.
Percentage of cells displaying the dendritic morphology typical of osteocytes after 14 days of culture on each substrate at an initial seeding density of either 103 cells/cm2 or 104 cells/cm2. Error bars indicate standard deviation of repeat wells. (a) Statistical difference with negative control (MC3T3’s on TC plastic at 104 cells/cm2, p<0.01). (b) Statistical difference with positive control (MLO-Y4’s on ColAA at 104 cells/cm2, p<0.01).

