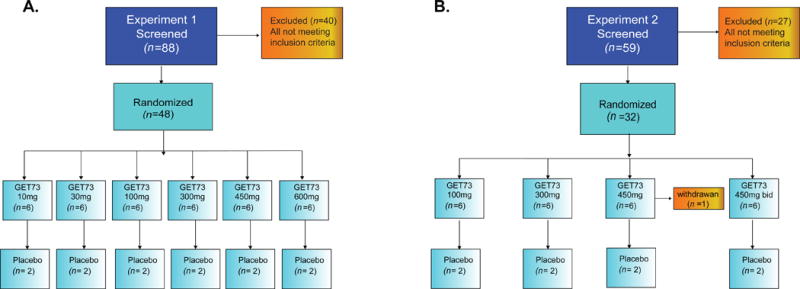
Figure 1. Study flowcharts related to the Experiment 1 (A) and Experiment 2 (B).

A) Experiment 1, Eighty-eight participants were screened and 48 healthy male volunteers (N = 48) were randomized into six groups of eight participants, six to receive GET 73 and two to receive placebo. B) Experiment 2, Fifty-nine participants were screened and 32 healthy male volunteers (N = 32) were randomized into four groups of eight participants, six to receive GET 73 and two to receive placebo. Individuals in groups 1 - 3 received 14 doses according to the randomization schedule, while individuals in group 4 received 28 doses. All groups were dosed sequentially with escalation to the next dose following review of emerging safety and tolerability data.
