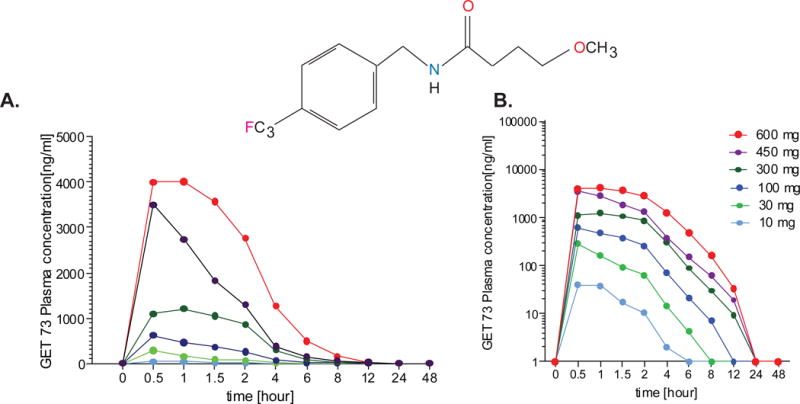
Figure 2. Experiment 1, GET 73 pharmacokinetics plasma concentration.

A GET 73 dose-related increase in mean maximum plasma drug concentration was observed, ranging from 48.35 (95% CI: 27.47 - 69.23) ng/mL in the 10-mg group, to 5015.00 (95% CI: 3061.38 – 6968.62) ng/mL in the 600-mg group, with median maximum plasma GET 73 concentration between 0.5 - 0.75 hours in all groups. Total exposure also increased with increase in GET 73 dose, ranging from 60.04 (95% CI: 25.97 – 94.11) ng/mL*h in the 10-mg group to 13338.25 (95% CI: 7495.02 - 19181.48) ng/mL*h in the 600-mg group. Results are reported as M ± SEM.
