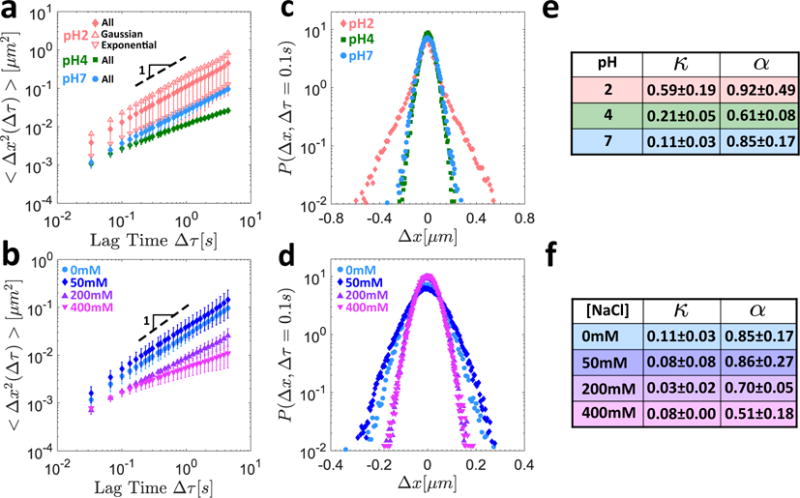
Figure 4.

Microrheological response of 10mg/mL MUC5AC gels to pH variations at zero salt concentration (a,c,e) and salt addition at neutral pH (b,d,f). The MSD as a function of the lag time is shown at different pH levels in (a) and for different salt concentrations at neutral pH in (b). The MSD is that of the aggregate particle populations for all gels. In addition, the individual MSDs corresponding to just the Gaussian and just the exponential particle populations are shown for the pH2 gel, with the error bars omitted for clarity. The van Hove correlations for the aggregate particle populations are shown at different pH levels in (c) and at different salt concentrations in (d). Summary tables of the non-Gaussian parameters κ and the anomalous diffusion exponents α are presented for the different pH levels and salt concentrations in (e) and (f), respectively.
